
Figure 1: RMS incidence varies with age and subtype.
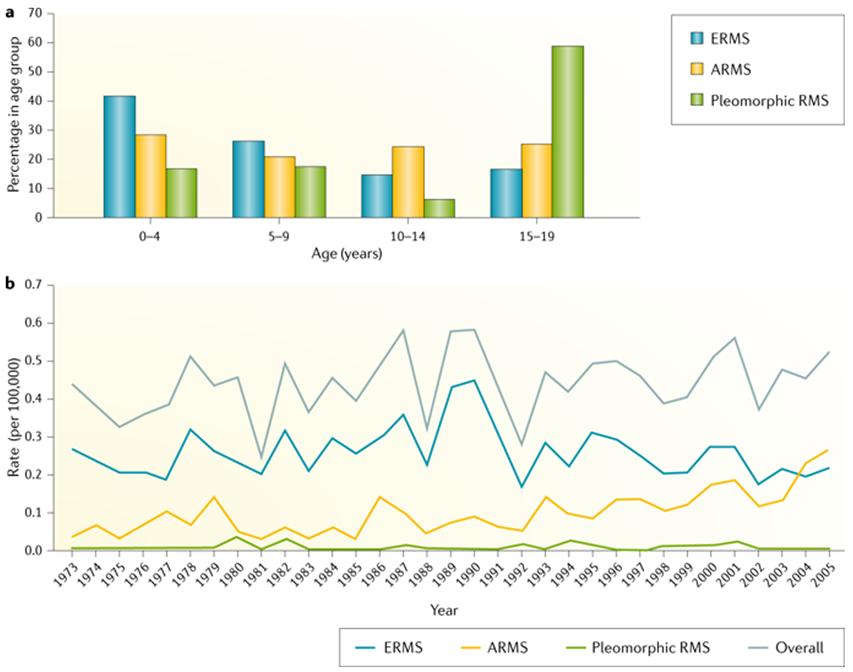
(A) Graph showing the relative proportion of each RMS subtypes presenting in various age groups. Spindle cell/sclerosing and botryoid forms not shown owing to their relative rarity. Note that relative frequency of PAX7-FOXO1 and PAX3-FOXO1 ARMS across the age spectrum has not been well studied and is captured by SEER. (B) Graph showing how the incidence of each major RMS subtype has changed or remained stable over the past ~30 years. The apparent increased incidence of ARMS since the 1990s, but that may, in part, relate to evolving diagnostic definitions, as described in the main text. Data are from the Surveillance, Epidemiology, and End Results (SEER) April 2008 release. Figure has been reproduced with permission from18. ARMS, alveolar rhabdomyosarcoma; ERMS, embryonal rhabdomyosarcoma.