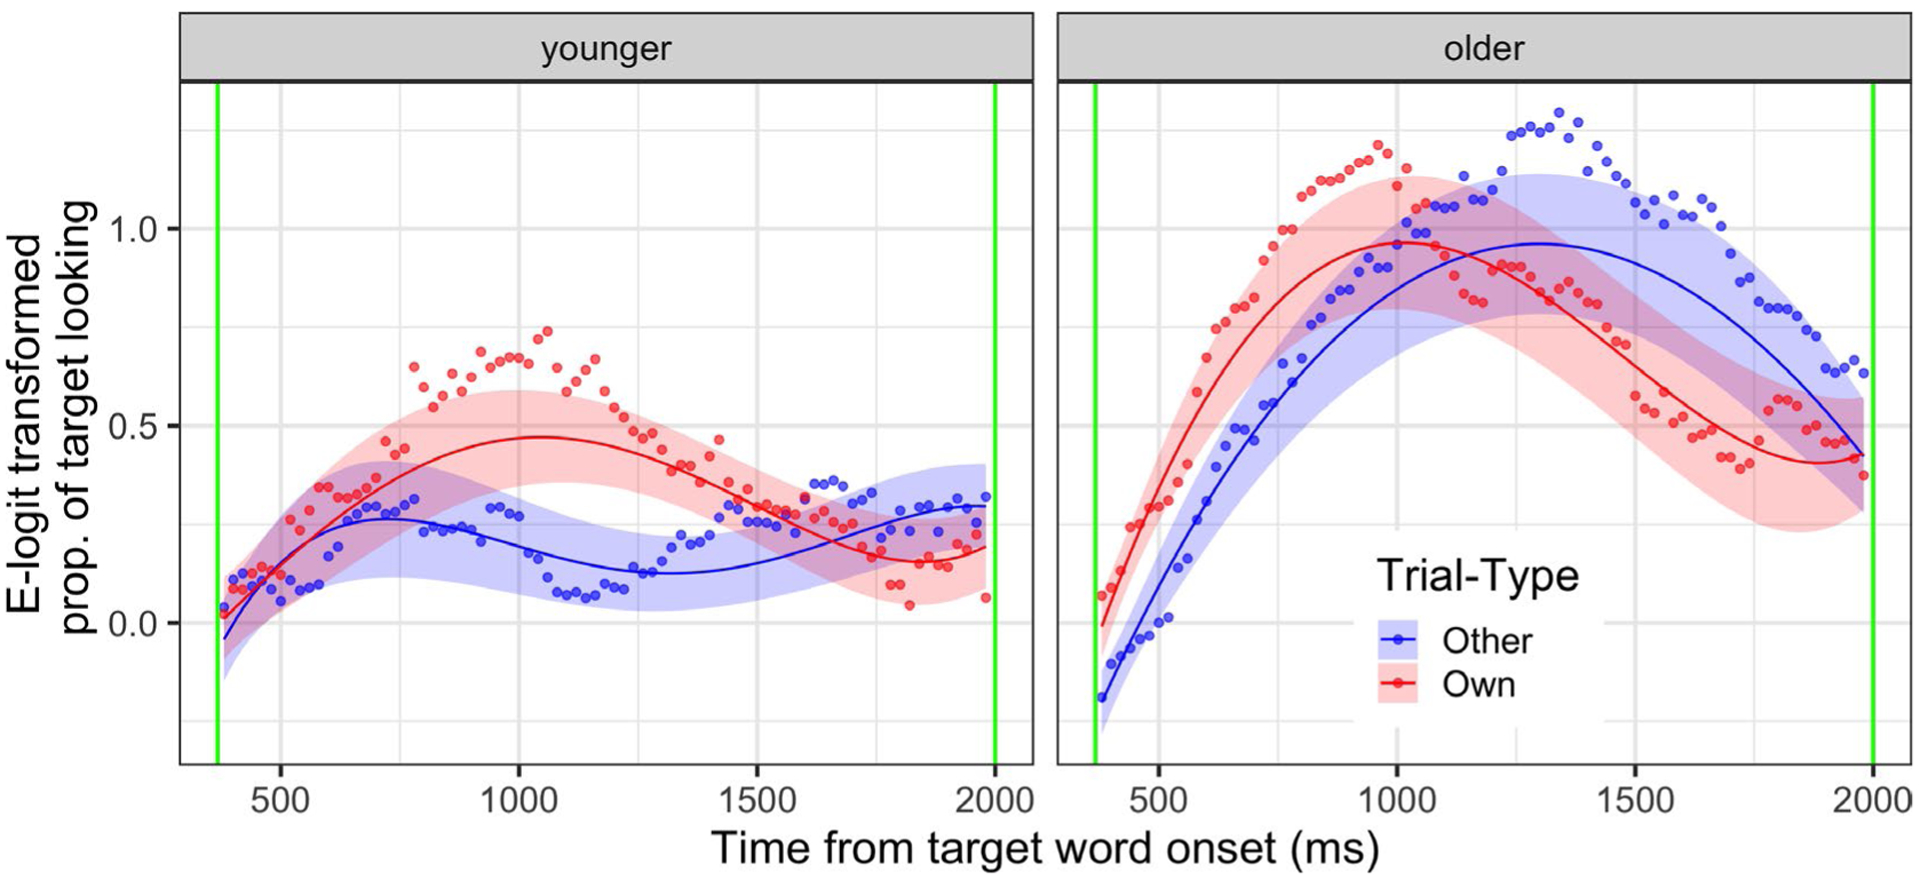
FIGURE 5.

Growth curve estimates of e(mpirical) logit-transformed mean proportion of target looking during analysis window, split by median age (14.7 m) and trial type (other vs. own). Line represents model estimates; ribbon represents standard error. Points represent mean value over 20-ms timebin, infant, and trial type. e-logit value of 0 corresponds to a proportions of 0.5 in the preceding figure
