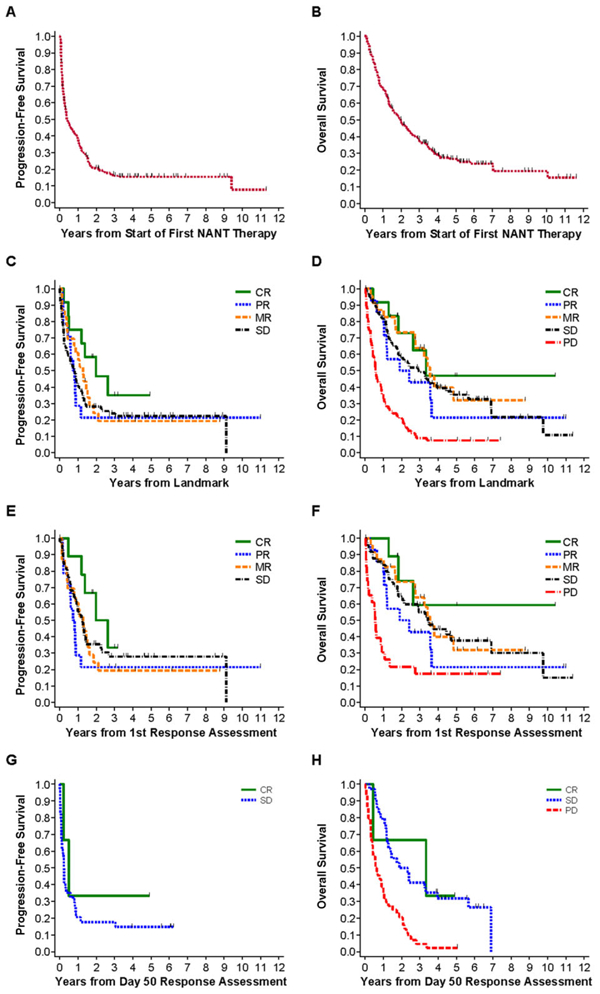
FIGURE 1.

PFS and OS analyses and association with patient’s overall response. PFS/OS are from start of NANT therapy (1A/1B), or from chosen response landmark (1C-H). The overall response assessment used for these analyses was the first overall response for PBSC-supported trials and the Day 50 overall response for non-PBSC supported trials. (A) PFS of all 213 first enrollments on all trials, PFS at 2 years = 21 ± 3%. (B) OS of all 213 first enrollments on all trials, OS at 2 years = 50 ± 3%. (C) PFS of patients treated on all trials grouped by overall response. CR (n = 12) versus PR (n = 14) versus MR (n = 23) versus SD (n = 84), trend: P = 0.40. (D) OS of patients treated on all trials grouped by overall response. For CR (n = 12) versus PR (n = 14) versus MR (n = 23) versus SD (n = 84) versus PD (n = 69), trend: P < 0.001. When PD is excluded, trend: P = 0.73. (E) PFS of patients treated on PBSC trials grouped by overall response. CR (n = 9) versus PR (n = 14) versus MR (n = 23) versus SD (n = 50), trend: P = 0.60. (F) OS of patients treated on PBSC-supported trials grouped by overall response. For CR (n = 9) versus PR (n = 14) versus MR (n = 23) versus SD (n = 50) versus PD (n = 23), trend: P = 0.014. When PD is excluded, trend: P = 0.74. (G) PFS of patients treated on non-PBSC trials grouped by overall response. CR (n = 3) versus SD (n = 34): P = 0.44. (H) OS of patients treated on non-PBSC trials grouped by overall response. For CR (n = 3) versus SD (n = 34) versus PD (n = 44), trend: P < 0.001. When PD is excluded, P = 0.89
