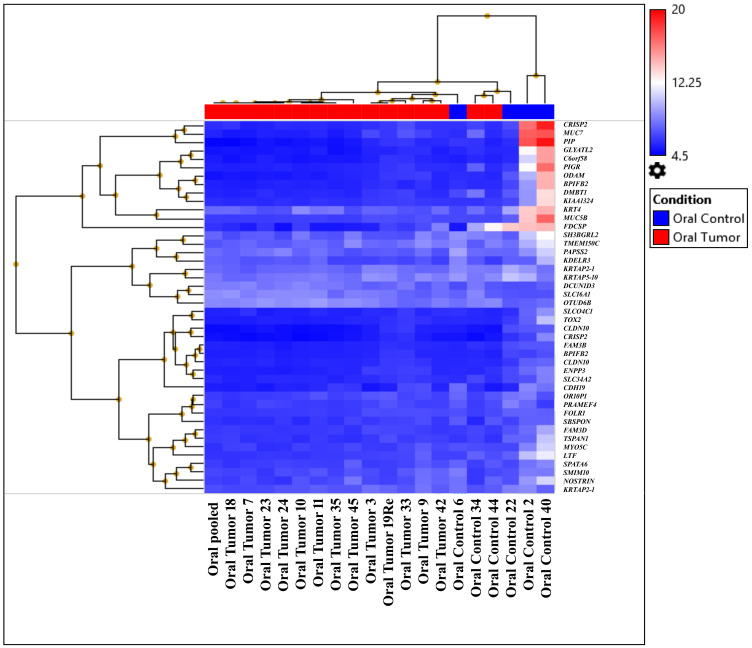
Figure 2. Heat map created based on the expression patterns of each gene across tumor and control samples.
The samples were clustered into two subgroups distinct from their normal counterparts by hierarchical clustering (first subgroup: OT-19, OT-3, OT-35, OT-7, OT-23, OT-24, OT-11, OT-pooled, OT-18, OT-10, and OT-34; second subgroup: OT-42, OT-9, OT-45, OT-44, and OT-33).

