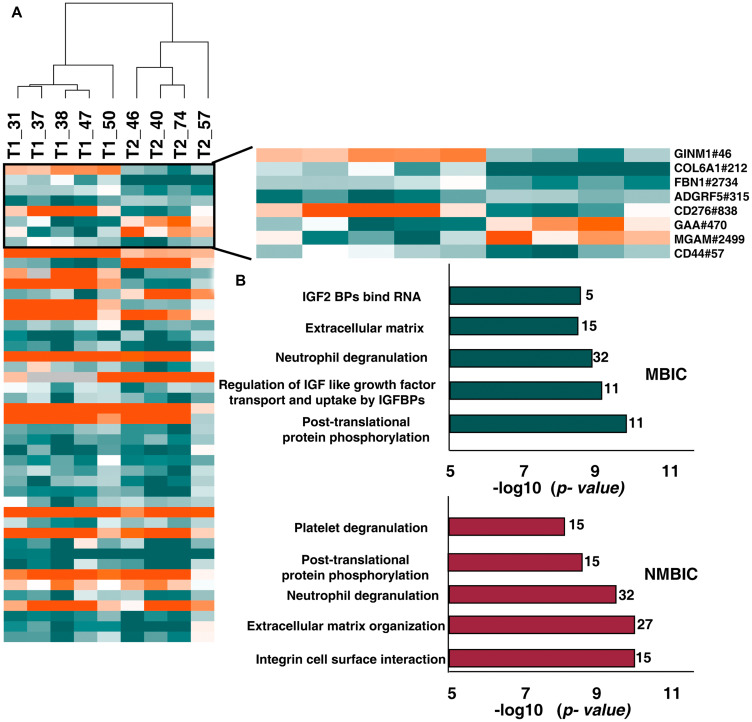
Figure 5. Comparison between N-glycoproteome and proteome of NMIBC and MIBC patients.
(A) Heatmap representing the differentially glycosylated peptides in NMIBC and MIBC patients. Highlighted are the proteins with significant glycosylation (> 2-fold) without any change in protein expression level. (B) Top 5 enriched pathways in NMIBC and MIBC patients. Reactome analysis identified integrin cell surface interaction as most enriched in NMIBC and post-translational modification as most enriched pathway in MIBC.

