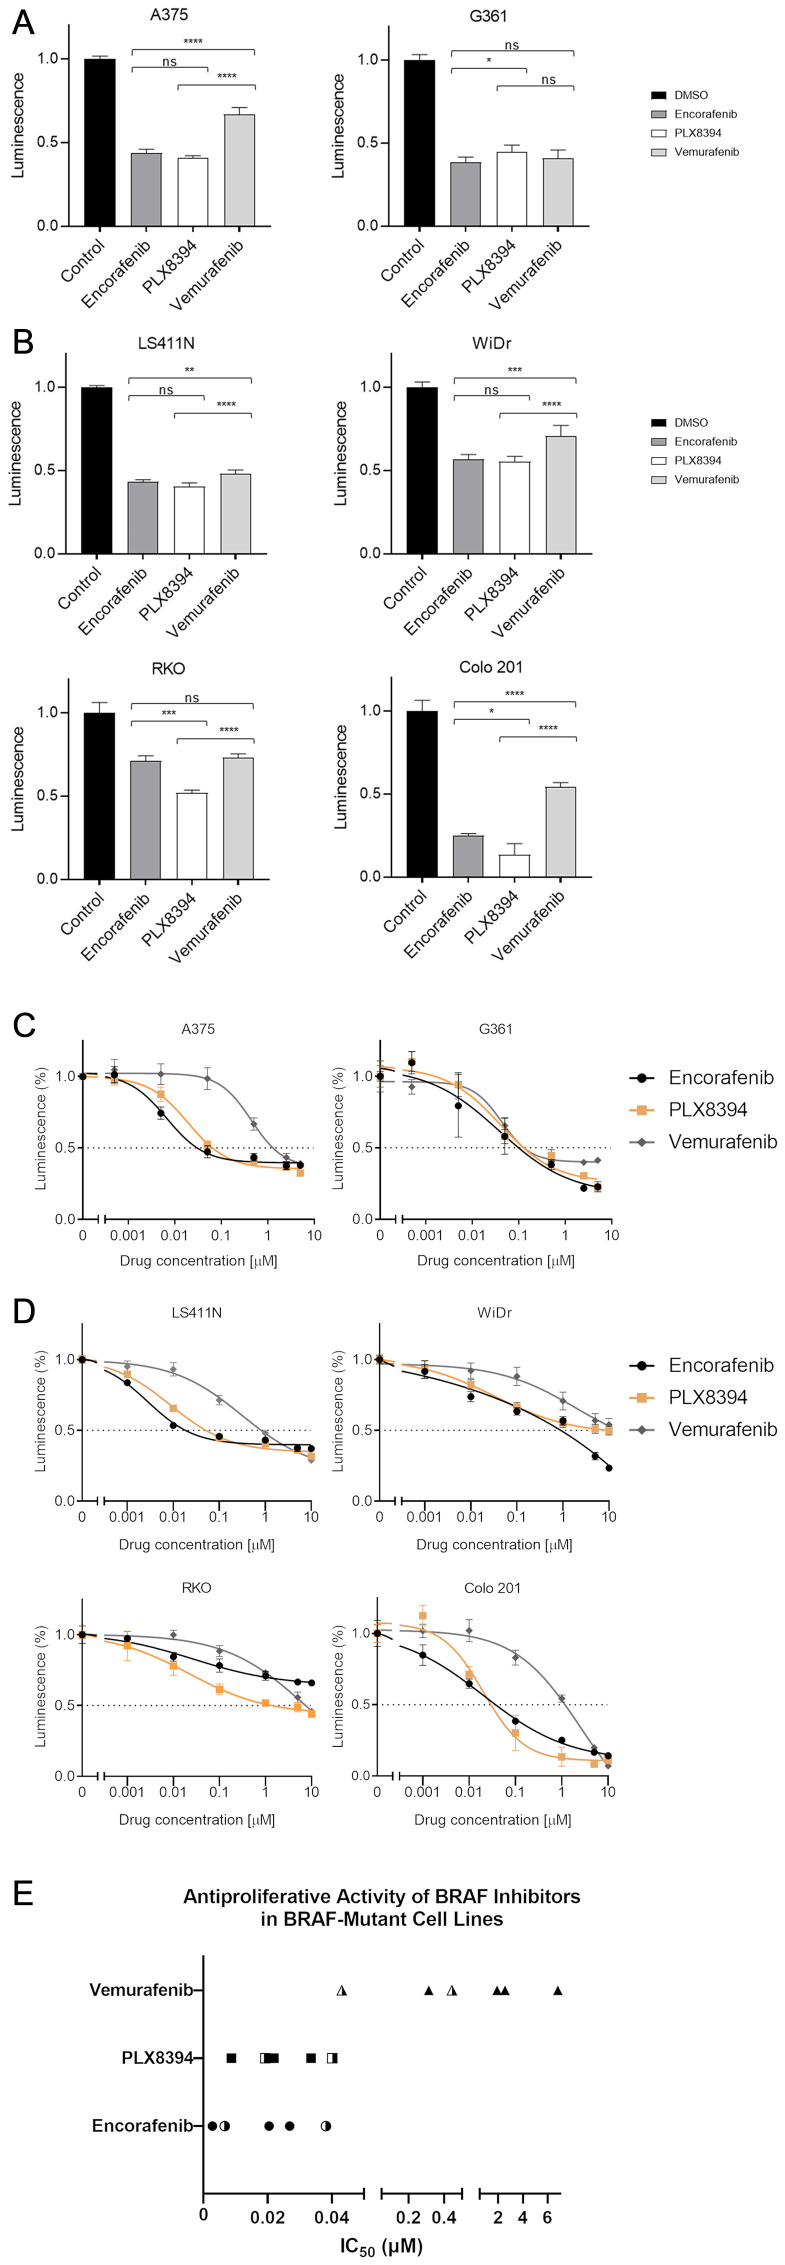
Figure 1. BRAF inhibitor-induced changes in cell viability.
BRAF-mutant melanoma (A) and colorectal cancer (B) cell lines were treated with respective inhibitors at 1 μM for 48 hours prior to measuring luminescence. Changes in viability were measured using RealTime-Glo™ MT Cell Viability Assay and reported relative to vehicle-treated control. Mean values with standard deviations plotted from 5 replicates. Significance levels legend: Not significant (NS) P > 0.05; * P ≤ 0.05; ** P ≤ 0.01; *** P ≤ 0.001; **** P ≤ 0.0001. N.B. Statistics for all drugs vs control not shown for ease of display and interpretation, all 3 compounds highly significant (P < 0.0001). Drug dose response curves. Sensitivity to respective BRAF inhibitors was evaluated in melanoma (C) and colorectal (D) cell lines. Cells were treated with 10,000-fold dilution series (0.001 μM to 10 μM) of respective BRAF inhibitors for 48 hours. Cell viability was assessed using RealTime-Glo™ MT Cell Viability Assay and reported relative to vehicle-treated control. The x-axis represents the log transformed inhibitor dose concentration. Mean values with standard deviation plotted from five replicates. (E) Derived IC50 values of BRAF inhibitors in melanoma and CRC cell lines (half-filled and filled symbols, respectively).

