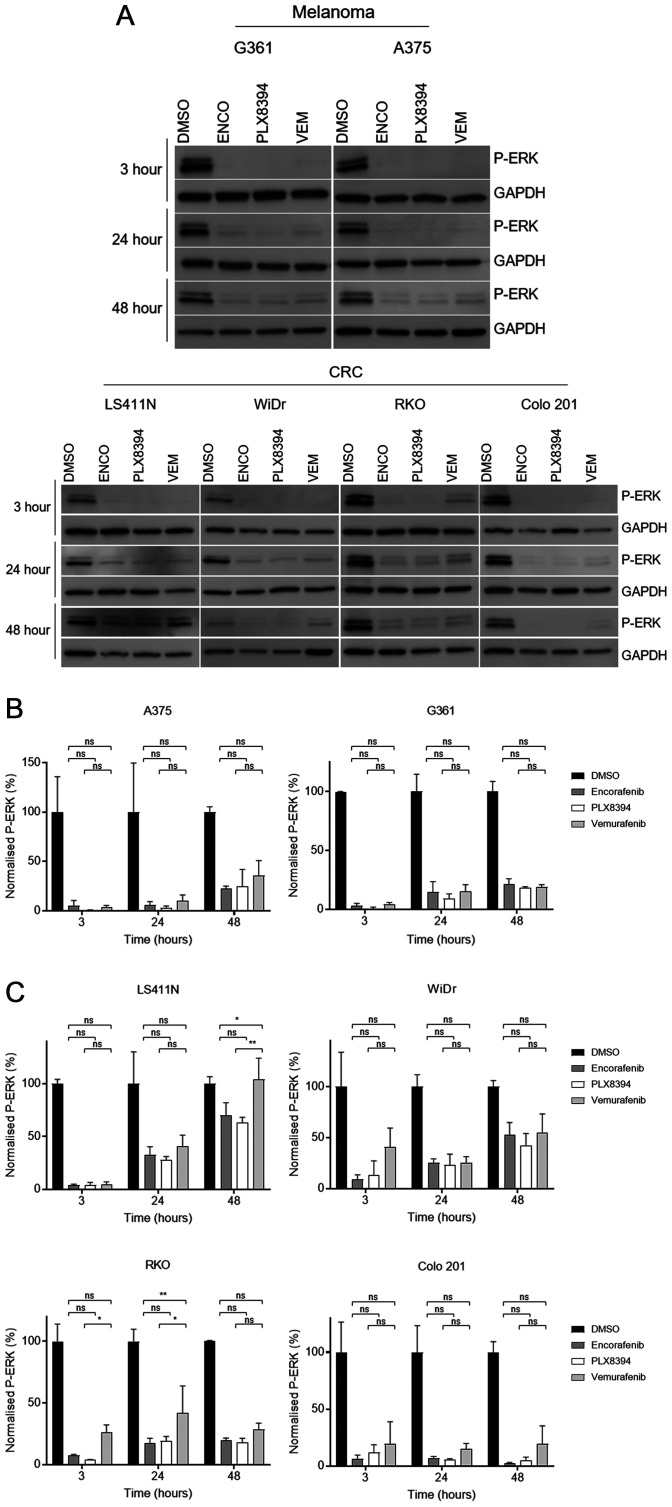
Figure 2. Assessment of MAPK pathway reactivation following BRAF monotherapy in BRAF-mutant cells.
(A) The level of ERK phosphorylation (P-ERK) following treatment with vehicle (0.2% DMSO) or 1 μM of each drug was determined by western blot. Results for both melanoma (top) and CRC (bottom) cell lines shown at 3, 24, and 48 hour time points. GAPDH loading control for each blot shown. Experiments performed in triplicate with representative results shown. (B–C) Western blot quantification by densitometry. Phosphorylated ERK (P-ERK) levels quantified and normalised to loading control in melanoma and CRC-derived cells (B and C, respectively). Expressed as percentage of control for each time point. Mean values with standard deviation plotted (n = 3). Significance levels legend: NS P > 0.05; * P ≤ 0.05; ** P ≤ 0.01; *** P ≤ 0.001; **** P ≤ 0.0001. N.B. Statistics for all drugs vs control not shown for ease of display and interpretation, all 3 compounds highly significant (P < 0.0001).

