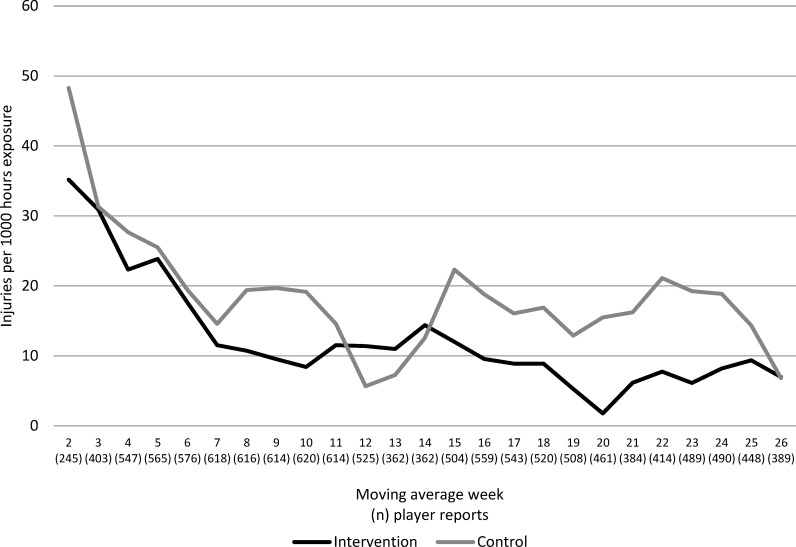
Figure 2.
Sex-adjusted injury incidence per week, based on moving average (moving average week 2=competitive week 1+2; moving average week 3=competitive week 2+3, etc) in the intervention group (black line) and control group (grey line). Values within parentheses on the x axis show the number of weekly player reports for each moving average week observation.

