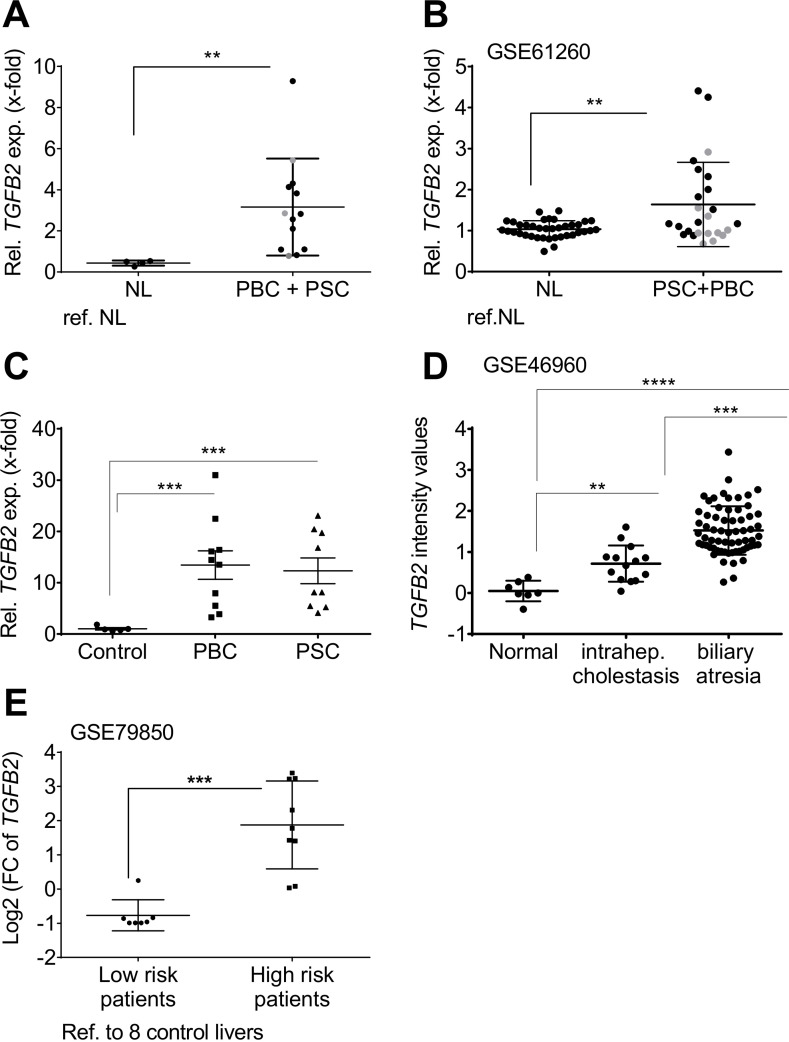
Figure 1.
Patient resolved expression of TGFB2 in tissue of cholestatic liver disease patients compared with healthy individuals. Expression changes of TGFB2 in liver tissue of individual patients represented as single dots in (A) the PSC/PBC cohort from Regensburg, (B) the collective GSE61260, (C) the PBC and PSC cohort from Poland, (D) the cohort GSE46960 and (E) in low-risk and high-risk patients described in GSE79850 as determined in comparison to non-diseased control livers. In (E), low-risk patients responded fully to UDCA treatment. High risk was assigned to the need of liver transplantation in the course of disease. Grey dots: PBC; black dots: PSC; **p≤0.01; ***p≤0.001; ****p≤0.0001; NL, normal liver; PBC, primary biliary cholangitis; PSC, primary sclerosing cholangitis; TGFB, transforming growth factor beta; UDCA, ursodeoxycholic acid.

