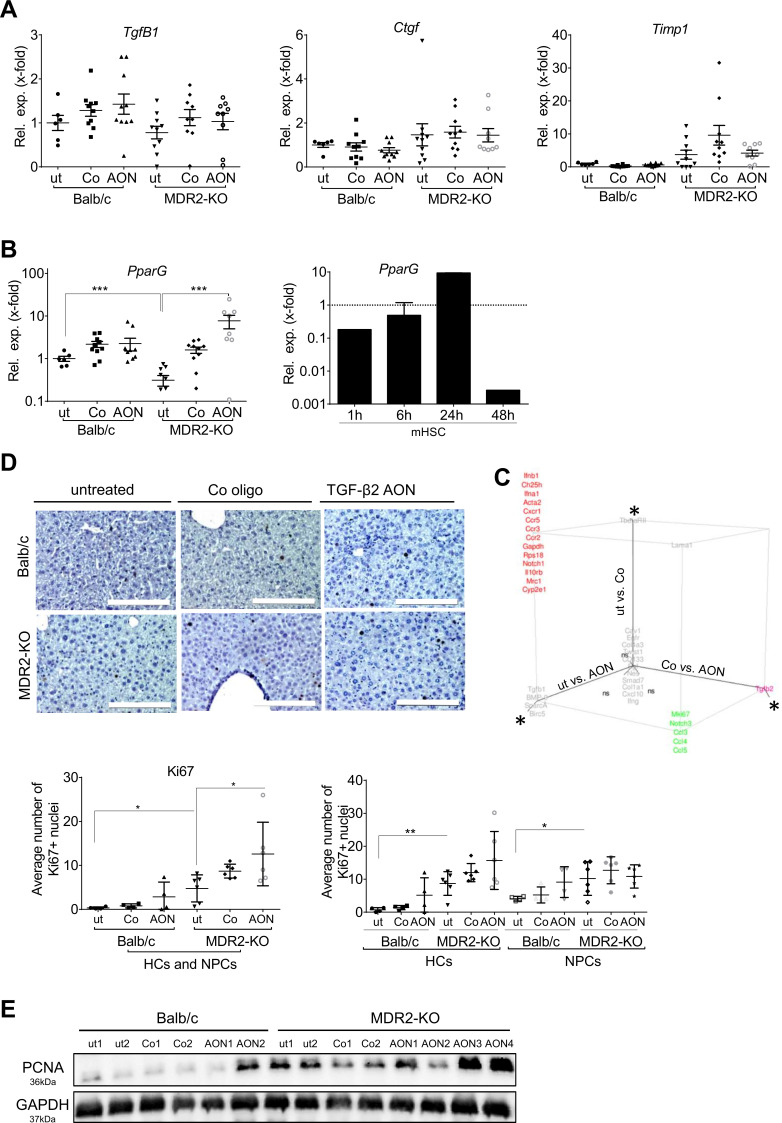
Figure 6.
Regulation of fibrosis marker gene expression by TgfB2 silencing. (A) TgfB1, Ctgf and Timp1 mRNA expression was not considerably changed by TgfB2-directed AON treatment. (B) Expression of antifibrotic and anti-inflammatory PparG was markedly upregulated by AONs in MDR2-KO mice. According to a profibrotic role of TGF-β2, TGF-β2 treatment of primary mHSCs inhibited PparG expression. Error bars represent SD for the mHSC experiment. ***p≤0.001. (C) Fluidigm analysis of fibrotic and inflammation-related marker genes (see online supplementary table 6) revealed specific AON-based effects of TgfB2 downregulation as well as placebo-associated effects of oligo treatment in MDR2-KO mice (also see online supplementary table 5) presented as 3D plot. Log2FC values are shown. Changes were considered significant, if Log2FC was >0.5 or <−0.5 and one-way analysis of variance plus Tukey analysis revealed p-values<0.05, here shown as *; ns=non-significant. (D) Ki67 expression was detected by immunohistochemistry in liver tissue of treated and untreated Balb/c and MDR2-KO mice. Quantification was performed for all cells as well as separated for hepatocytes (HC) and non-parenchymal cells (NPC). *p≤0.05, **p≤0.01. Scale bars indicate 200 µm. (E) Immunoblot analysis of PCNA expression. AON, antisense oligonucleotides; Ctgf, connective tissue growth factor; MDR2-KO, multidrug resistance gene 2 knockout; PCNA, proliferating cell nuclear antigen; Ppar, peroxisome proliferator-activated receptor; TGFB, transforming growth factor beta; Timp, tissue inhibitor of metalloproteinases.

