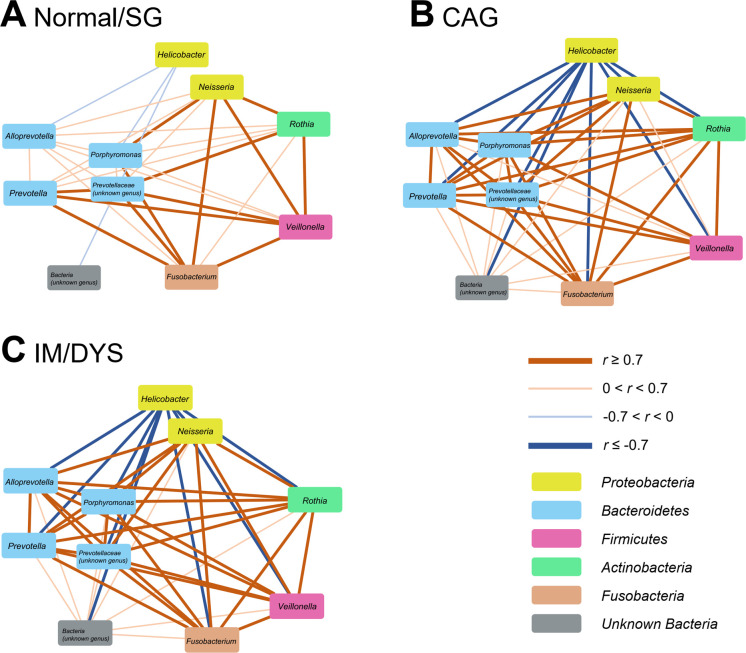
Figure 4.
Correlation networks of specific gastric genera in different gastric lesion groups. Spearman correlation analysis was performed to calculate the correlation coefficients (R values) between specific gastric genera. Visualised networks of significant correlations (p<0.05) by Cytoscape V.3.6.1 showed stronger correlation strengths of specific gastric genera in (B) CAG and (C) IM/DYS groups than in (A) normal/SG group. CAG, chronic atrophic gastritis; DYS, dysplasia; IM, intestinal metaplasia; SG, superficial gastritis.

