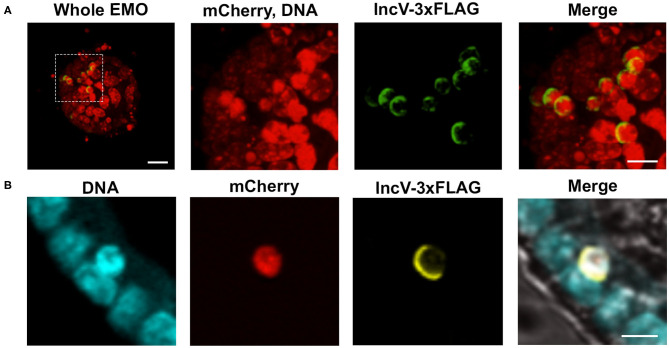
Figure 4.
Induction of gene expression and inclusion localization of an Inc protein within infected murine EMOs. (A) 3D confocal micrographs of an EMO infected for 30 h with mCherry-expressing C. trachomatis constitutively (red) and IncV-3xFLAG under the control of an aTc inducible promoter (green), and stained with TO-PROTM-3 (red, DNA). A low magnification merge image corresponding to the whole EMO is shown on the left (Whole EMO). Scale bar: 40 μm. A high magnification of individual channels and the merge image of the indicated boxed area is shown in the three panels to the right. Scale bar: 20 μm (B) Confocal micrographs of an EMO infected for 30 h with C. trachomatis expressing mCherry constitutively (red) and IncV-3xFLAG under the control of an aTc inducible promoter (yellow), stained with SYTOXTM Blue (blue, DNA) and antibodies against FLAG (yellow, IncV-3xFLAG). The merge, including a brightfield image, is shown on the right. A single plane across the middle of the EMO and inclusion is shown. Scale bar: 20 μm.

