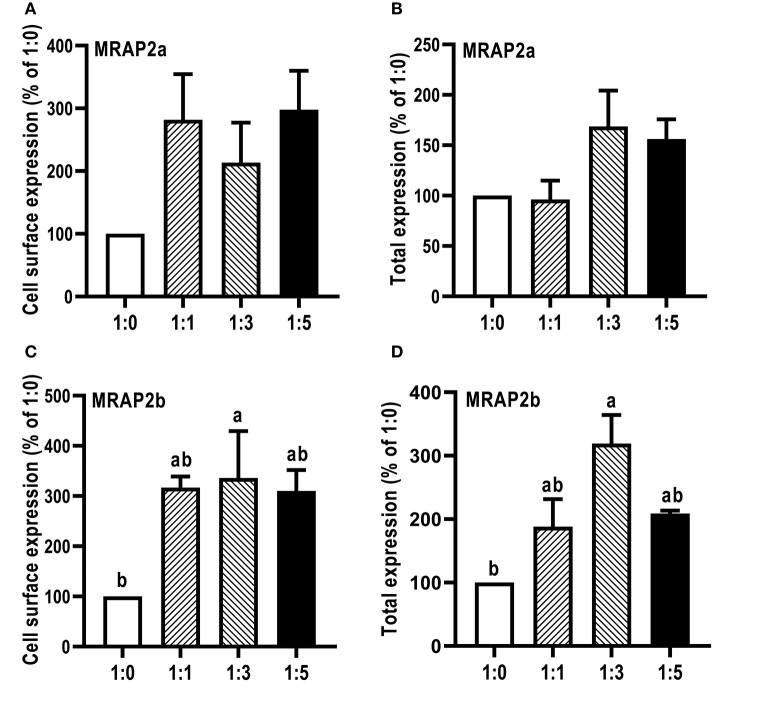
Figure 7.
Modulation of caMC4R expression by caMRAP2a or caMRAP2b. Cell surface (A,C) and total expression (B,D) of caMC4R was measured by flow cytometry. HEK293T cells were cotransfected with different ratios of caMC4R/caMRAP2a or caMC4R/caMRAP2b (1:0, 1:1, 1:3, and 1:5). The results were calculated as % of 1:0 group after correction of the background staining (fluorescence in cells transfected with empty vector, pcDNA3.1). Each data point represented the mean ± SEM (n = 3–4). Different letters indicated significant difference (P < 0.05) (One-way ANOVA followed by Tukey-test).

