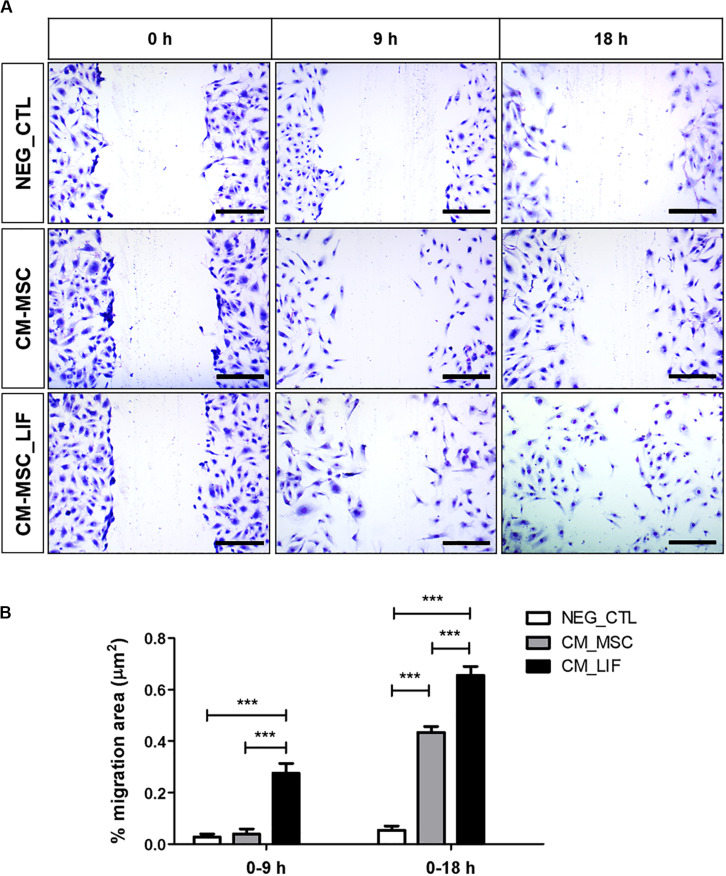
FIGURE 6.
In vitro endothelial cell migration. (A) Representative image of the migration of HUVEC cells, stained with violet crystal, after 9 or 18 h of incubation in conditioned medium of MSC (CM-MSC) or MSC_LIF (CM-MSC_LIF). (B) Quantification of the percentage of variation in the wound area (% migration area). The two-way ANOVA test and the Bonferroni post-test were used to analyze the differences among the groups. Values are expressed as mean ± SEM of at least three independent experiments. ***p < 0.001. Scale bars = 250 μm.

