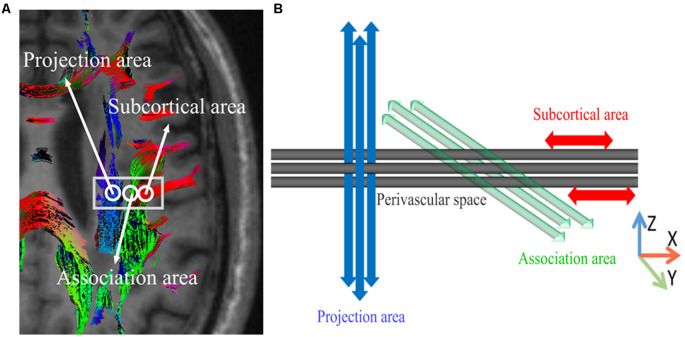
Figure 1.
The concept of the diffusion tensor image analysis along with the perivascular space (DTI-ALPS) method for perivascular diffusion. (A) The DTI superimposed color display shows the distribution of projection fibers (z-axis: blue), association fibers (y-axis: green), and subcortical fibers (x-axis: red). Three regions of interest (ROIs) were placed in the area with projection fibers (projection area), association fibers (association area), and subcortical fibers (subcortical area) to measure the diffusivities in three directions (x, y, and z). (B) Schematic diagram showing the relationship between the direction of the perivascular space (gray cylinder) and the direction of the fibers. Note that the direction of the perivascular space is perpendicular to the projection and the association fibers. The figure has been reprinted with permission from Taoka et al. (2017).

