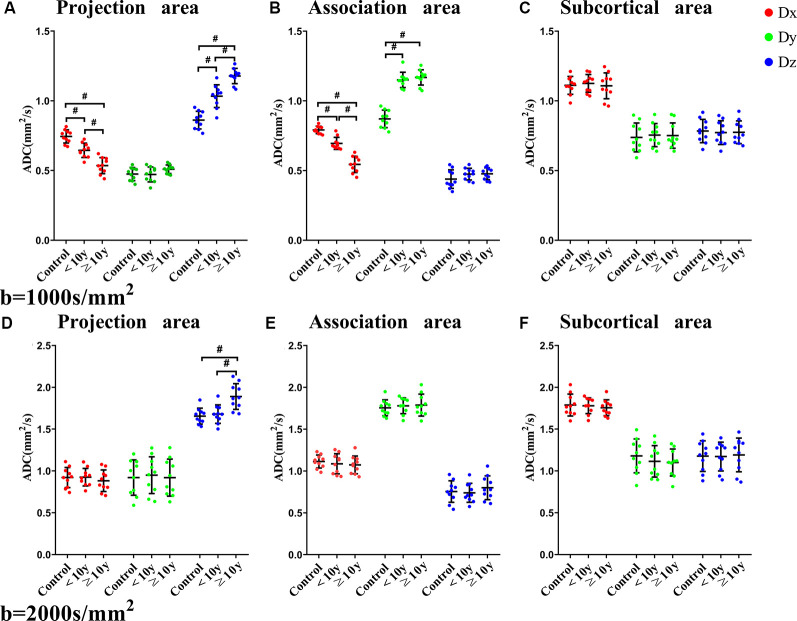
Figure 2.
The relationship between directional diffusivity and the history of T2DM. Relationship between a history of T2DM and diffusivities for the three directions of the three areas [projection (A,D), association (B,E), subcortical (C,F)] with the b = 1,000 s/mm2 datasets (A,B,C) and the b = 2,000 s/mm2 datasets (D,E,F). The diffusivity of the x-axis is plotted in red, the y-axis is plotted in green, and the z-axis is plotted in blue. Statistically, significant differences are indicated by #.

