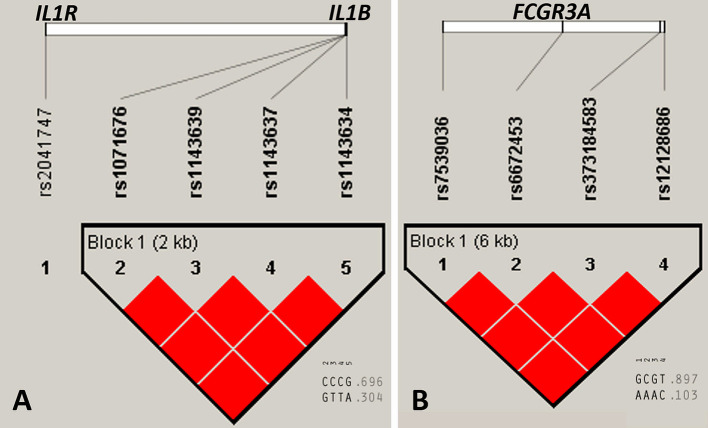
Figure 3.
Linkage disequilibrium (LD) plots of selected gene variants for the whole study group. (A) IL1R and IL1B genes, (B) FCGR3A gene. Numerical values below (0.696, 0.304, 0.897, and 0.103) represent haplotype frequencies. Red color of squares indicates D’ = 1, where the D’ represent statistics for each pairwise comparison. The LD plot was generated with Haploview v.4.2 software (Gabriel et al., 2002; Barrett et al., 2005).

