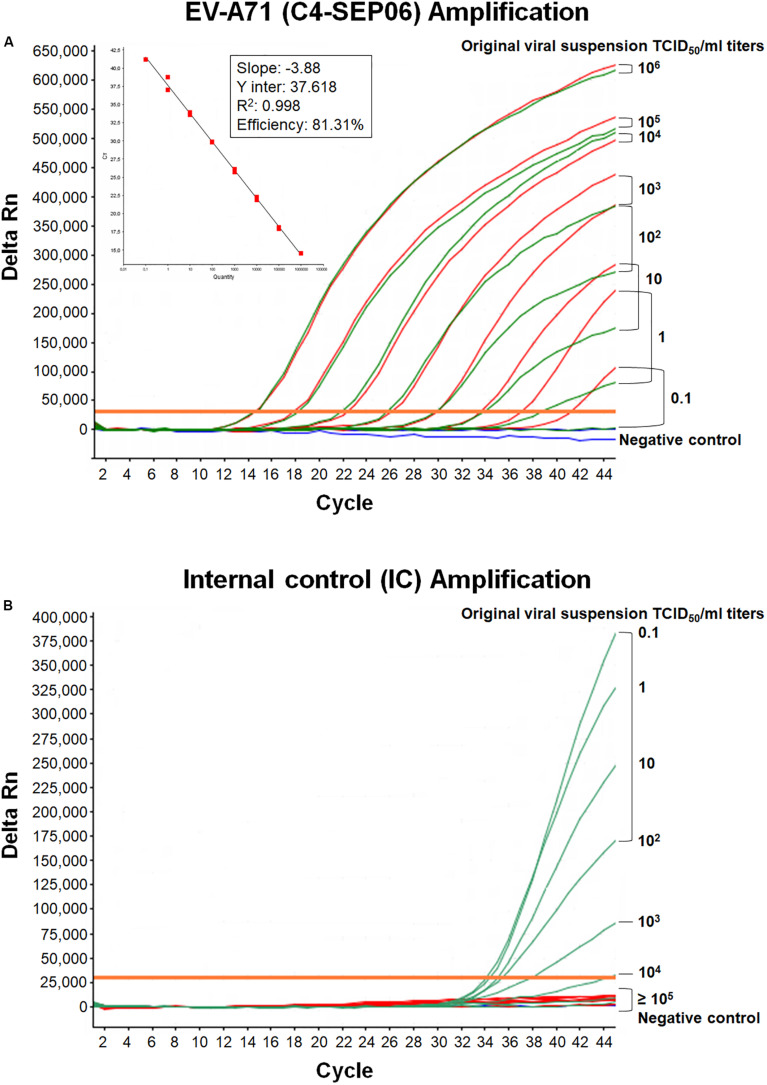
FIGURE 2.
Mutual interference between EV-A71 and IC. (A) RNA genomes were extracted from 10-fold serially diluted C4-SEP06 viral suspensions (from 106 to 0.1 TCID50/ml in DMEM medium) with (green curves) or without (red curves) a fixed amount of IC RNA (105 RNA copies). They were then subjected to amplification in the same duplex real-time RT-PCR. The linear regression line is shown with its associated correlation coefficient (R2 value) and the amplification efficiency (shown as a percentage), as given by the ABI 7500 software. The negative control (DMEM medium) is shown in blue. (B) The IC RNA curves corresponding to the green EV-A71 RNA curves in panel (A).

