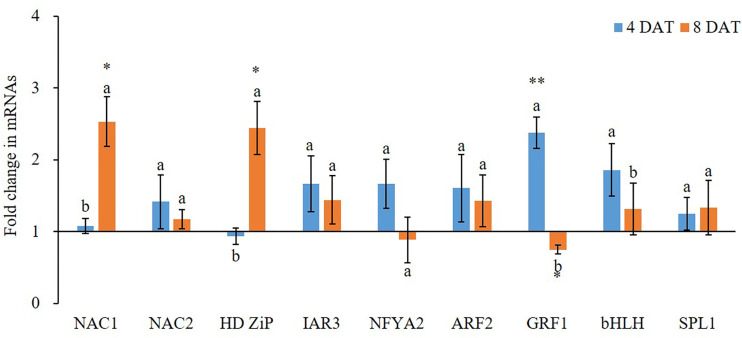
Figure 3.
Fold change of miRNA target gene expression between low K+ treatment and the controls at 4/8 days after transfer day (DAT). Error bars represent S.E. (n = 3). Highly significant difference was marked as ** to represent a p value < 0.01 and as * to represent a p value < 0.05 between low K+ treatment and the controls. The different letters on the bars indicate significant differences of fold change of miRNA target expression between 4 and 8 DAT according to the LSD test (P = 0.05).

