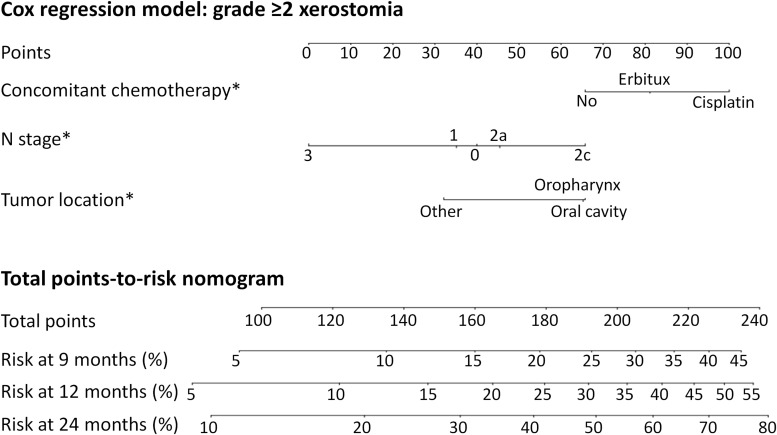
FIGURE 3.
The predicted risk of grade ≥2 xerostomia at 9, 12, and 24 months after radiotherapy, not including dose, due to the inverse dose-response relationship. Model specifics are listed in Supplementary Table A2 in the Supplementary Material. *Note that the model does not imply significant differences between all categories with respect to the endpoint – the p-value only refers to the difference from the reference category (see Supplementary Table A2 for p-values). “No” was reference for concomitant chemotherapy and Erbitux was not significantly different from the reference. “N2c” was reference for N stage and N3 was not statistically different. Note that the model does not establish whether there is a difference between N0 and N1. “Oral cavity” was reference for tumor location and oropharynx was not statistically different.

