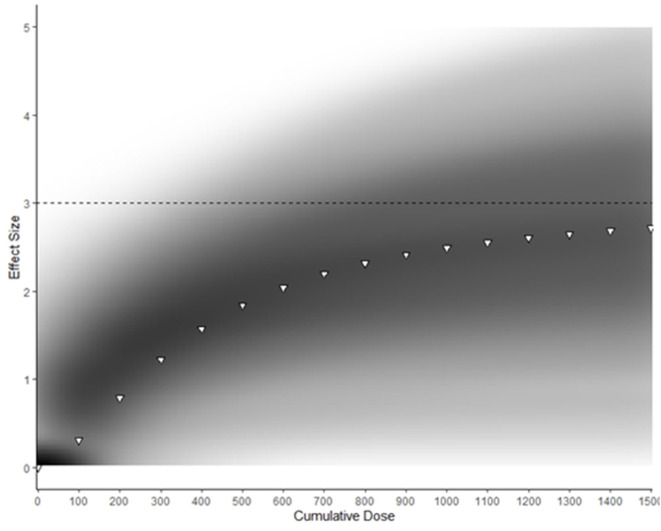
Figure 4.
Density plot of Bayesian Emax model predicting effect of cumulative BA supplementation on muscle carnosine content. Darker areas represent more common Emax trajectories. White triangles represent Emax generated with median parameter values. The dotted line represents the predicted maximum effect of BA supplementation on MCarn.

