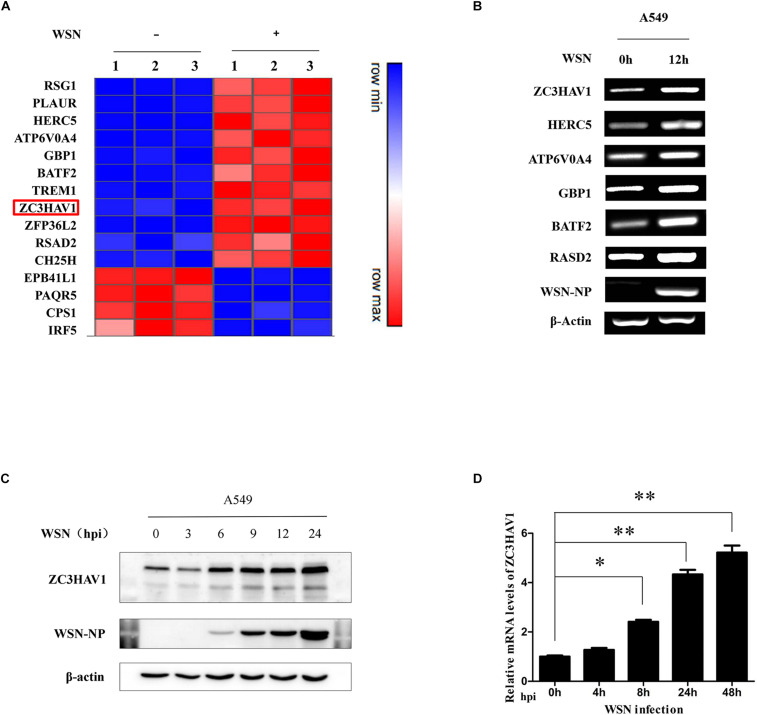
FIGURE 1.
Identification of differentially expressed genes in response to influenza A/WSN/33 virus infection. (A) Heat map showing microarray analysis of gene expression profile in A549 cells infected with mock and influenza A/WSN/33 virus for 12 h (MOI = 1). The identified genes were differentially expressed by ≥ 2-fold (n = 3) between mock and virus infection. Samples were obtained from three independent experiments. (B) The expression of the selected genes from microarray analysis was confirmed by RT-PCR. (C) The expression level of ZC3HAV1 in influenza A/WSN/33 virus-infected A549 cells was measured by Western blotting. (D) The expression of ZC3HAV1 in influenza A/WSN/33 virus-infected BALB/c mice was measured by qRT-PCR. Data are represented as mean ± SD. ∗p < 0.05; ∗∗p < 0.01.

