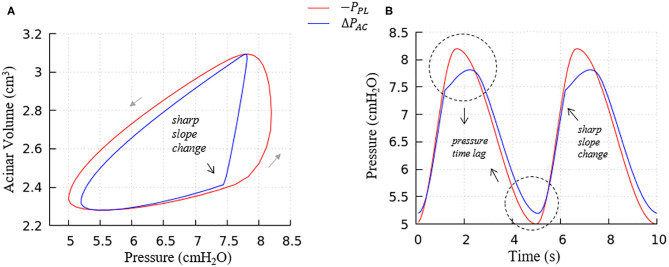
Figure 8.
Average acinar global forcing vs. local forcing. (A) PV relationship, (B) pressure vs. time, global (−PPL, red), local (ΔPAC = PAC−PPL, blue). Airway resistance leads to the hysteresis area difference between global and local forcing shown in (A) and the pressure time lag shown in (B), contributes to the global PV hysteresis behavior.

