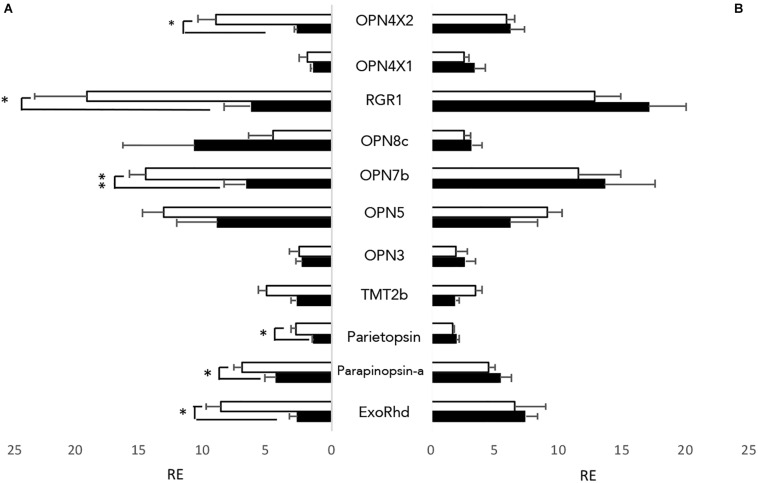
FIGURE 1.
Non-visual opsins expressed in zebrafish cell lines. All 32 non-visual opsins were explored by RT-qPCR in entrained zebrafish cell lines at opposite times of day; ZT3 (white) and ZT15 (black). 11 opsins showed detectable expression levels, using a cut-off value of <Cq 30. (A) Opsins expressed in PAC2 cell lines. (B) Opsins expressed in clockDN cell lines. Opsin expression is plotted relative to the lowest detectable opsin, with error bars depicting SEM. An unpaired students t-test was used to assess if the opsins expressed show a time of day specific expression pattern. ∗p < 0.05 and ∗∗p < 0.001 (n = 4).

