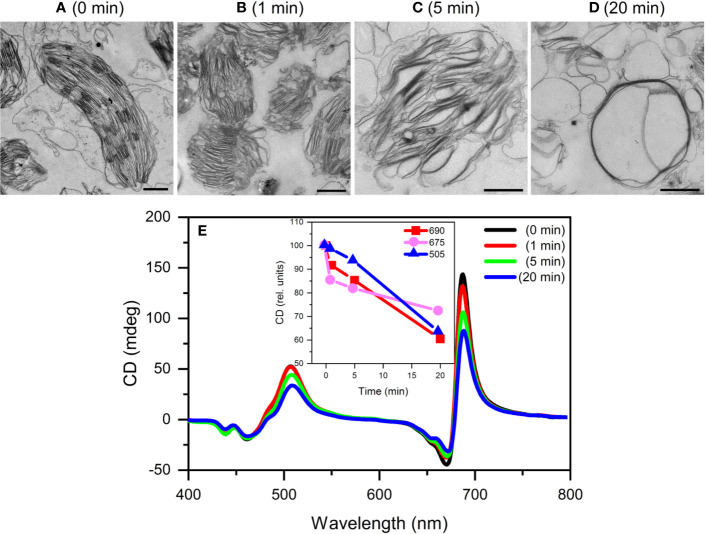
Figure 6.
Typical TEM images (A–;D) and CD spectra (E) of untreated (0 min) and 0.5 M NaSCN treated isolated pea thylakoid membranes obtained after different time intervals following the treatment at t=0 min. The treatments were halted at 1, 5 and 20 min by 2% glutaraldehyde and the membranes were then used for TEM and CD experiments. Inset in (E), time course of the variations in the different CDψ bands. Scale bars in (A–D), 1 μm.

