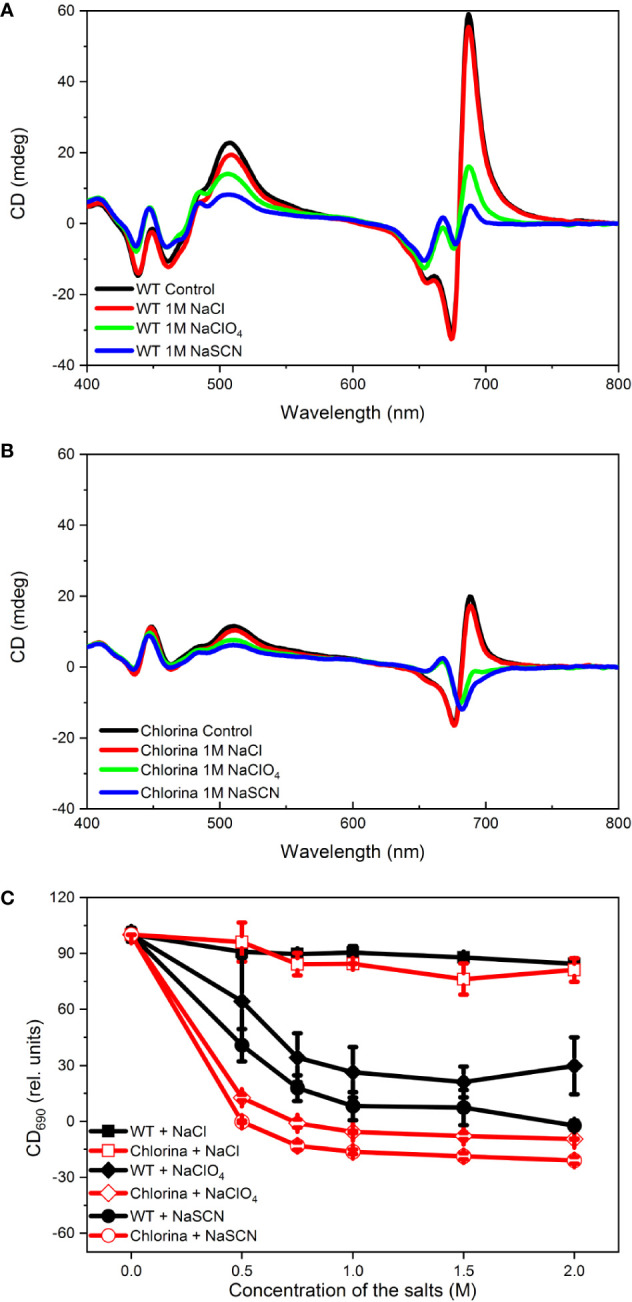
Figure 8.

Concentration dependence of the effects of NaCl, NaClO4 and NaSCN on the CD spectra of WT (A) and Chl-b-less (Chlorina) mutant (B) barley thylakoid membranes. The amplitudes of (+)690 CDψ (C), relative to the untreated control were determined 60 min after the addition of salts. Data points are representing the mean of 5 independent biological replicates ±SD.
