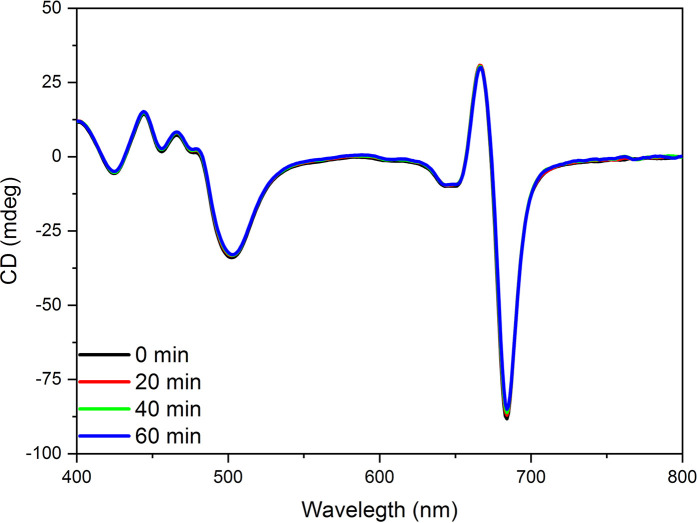
Figure 9.
CD spectra of untreated (0 min) and 2 M NaSCN treated LHCII microcrystals at different times after the start of the treatment, as indicated. The spectra are normalized to the red absorbance maximum [OD(680 nm)=1.0] of the untreated samples. Note that the 0, 20, 40, and 60 min traces overlap. Three independent biological replicates were measured and a typical data set is shown.

