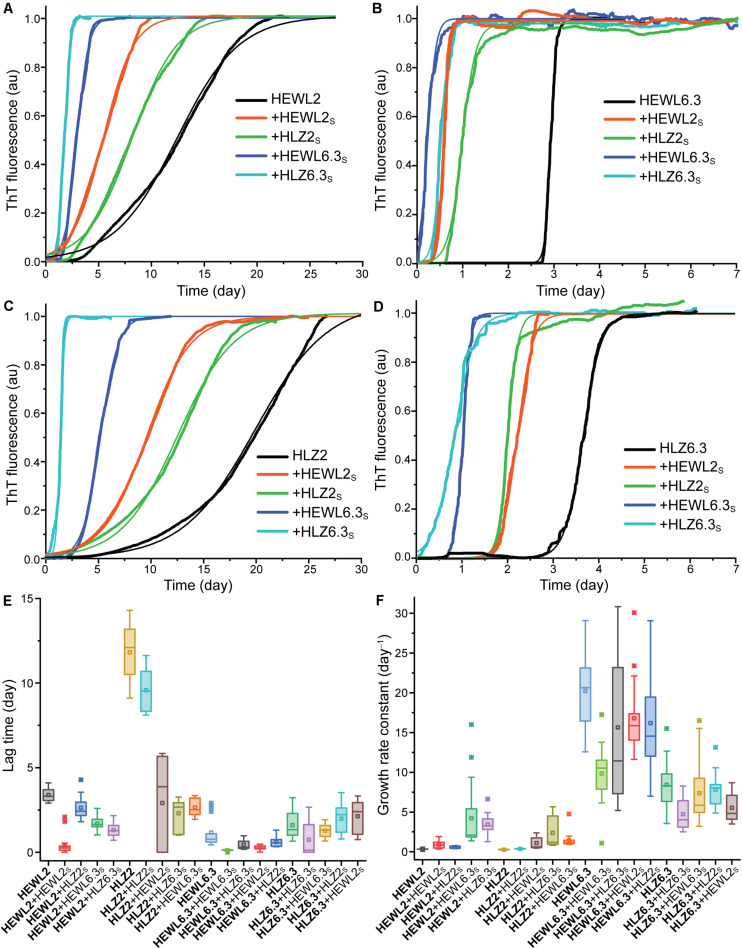
FIGURE 3.
Kinetics of amyloid formation. HEWL at (A) pH 2 and (B) pH 6.3. HLZ at (C) pH 2 and (D) pH 6.3. Reactions occurred at 45°C in a microplate reader with intermittent shaking. The seeded reactions are indicated by ‘ + ’ and the seed-type. Representative traces of ThT fluorescence (normalized to the maximum value) are shown, fitted with Eq. 1. Boxplots are shown for (E) lag-times and (F) growth rate constants, determined by fitting the data to Eq. 1. From left to right, the samples are arranged from unseeded, seeded, cross-seeded, cross-polymorph seeded, to cross-species-cross-polymorph seeded.

