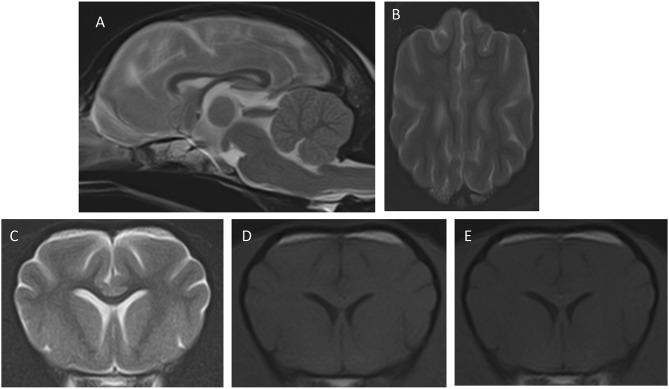
Figure 2.
Images of the second MRI study after the resolution of the clinical signs. The transverse and dorsal images are at similar levels as those in Figure 1. (A) Mid-sagittal T2W, (B) dorsal T2W, (C) transverse, T2W, (D) T1W pre-contrast, (E) transverse T1W post-contrast. Notice that the cerebellum shows normal position (A), the cerebral sulci are well-delineated (B), and the white and gray matter show good definition with normal signal intensity in all sequences.

