FIGURE 2.
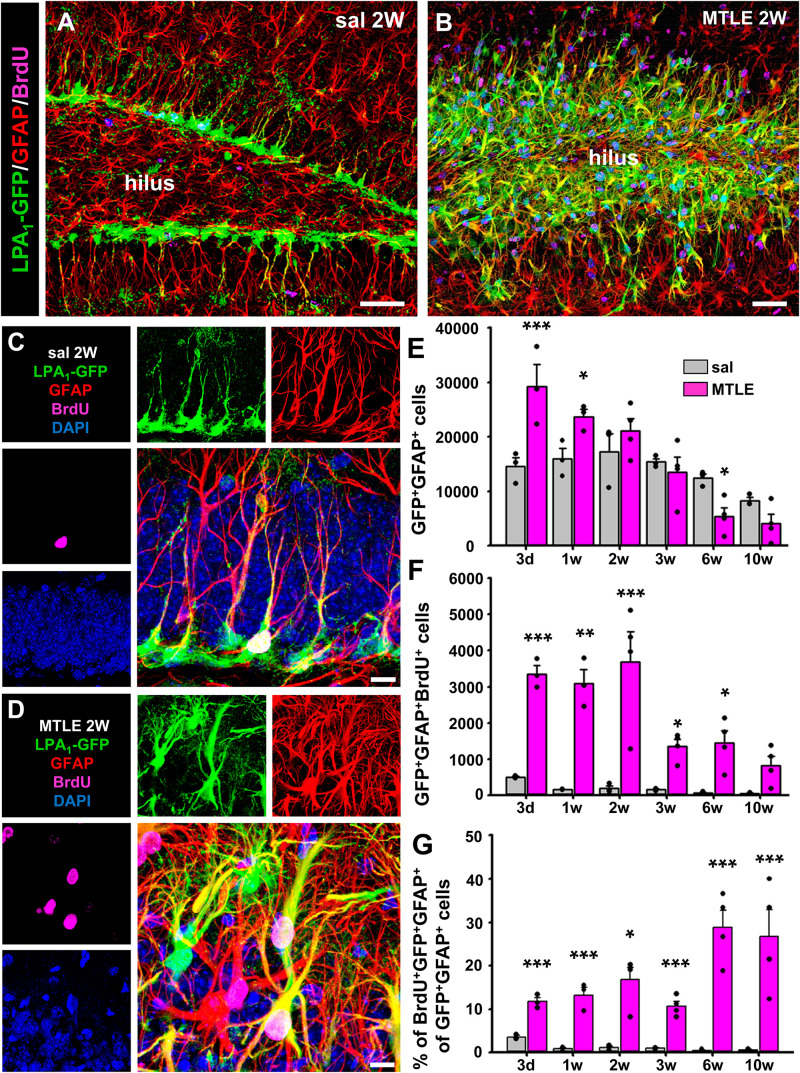
Lysophosphatidic acid receptor 1–GFP expression is maintained in seizure-induced React-NSCs. Control and MTLE mice were administered BrdU (four injections, 2 h apart) on the second day after surgery for the saline/KA intrahippocampal injection and then sacrificed 3 days or 1, 2, 3, 6, or 10 weeks after surgery. Expression of LPA1-GFP is restricted to GFAP-expressing NSCs in the SGZ in the control mice (A) and to GFAP-expressing React-NSCs located in the SGZ or GCL in the MTLE mice (B). In the molecular layer, GFAP-expressing astrocytes did not express LPA1-GFP as shown by z-stack projections obtained by confocal microscopy. The time-course analysis with BrdU costaining at higher magnification (C,D) shows an overall increase in the number of LPA1-GFP+GFAP+ cells in early time points and a later decline (E). The number of BrdU+ LPA1-GFP+GFAP+ cells is much higher in MTLE mice in every time point, but it decreases in the later ones (F). The percentage of BrdU+ LPA1-GFP+GFAP+ follows an opposite trend as it increases over time, although it is also much higher than in controls in all time points (G). Scale bar is 50 μm in (A,B) and 10 μm in (C,D). Data were analyzed by a two-way ANOVA. Post hoc Holm–Sidak was used to analyze differences between time points and sal vs. MTLE. Only the differences between sal vs. MTLE in each time are shown. *p < 0.05, **p ≤ 0.005, ***p ≤ 0.001.

