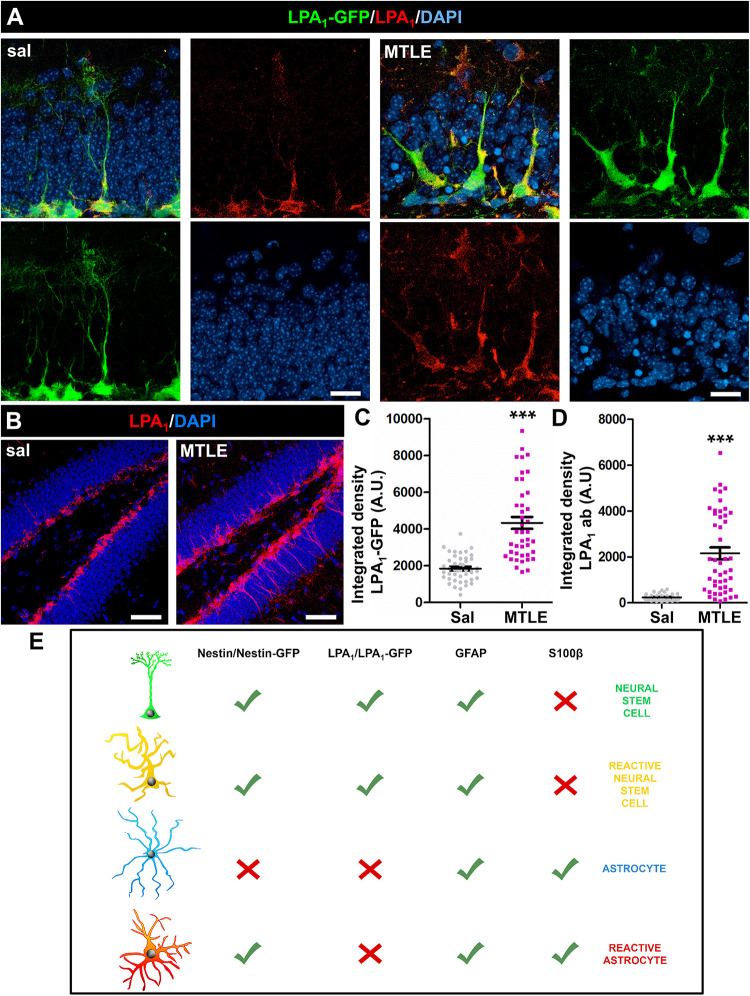
FIGURE 3.
Neural stem cells in sal-injected (A, left) and React-NSCs in MTLE LPA1-GFP mice (B, right) express LPA1 (3 days after surgery) as demonstrated by immunostaining with anti-LPA1 antibody. No other cell types were labeled with either LPA1-GFP or anti-LPA1 antibody in control or MTLE mice (B). The expression of LPA1-GFP (C) or LPA1 (D) was significantly increased in MTLE-induced React-NSCs compared to control NSCs as measured by the integrated density of the fluorescent signal. (E) shows the combination of biomarker expression that can be used to differentially identify NSCs, React-NSCs, astrocytes, and RAs. Scale bar is 10 μm in (A) and 50 in μm (B). Data were analyzed by a Mann-Whitney U test. Graphs show individual data and mean ± SEM. ***p ≤ 0.001.

