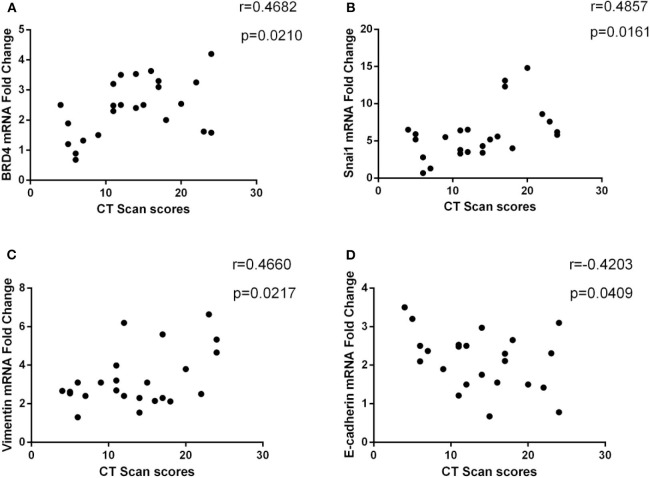
Figure 3.
(A) Correlation between CT scan score (Lund–Mackay) and BRD4 mRNA expression in CRSwNP (n = 24). (B–D) The association between CT scan score and E-cadherin, vimentin, and Snai1 mRNA expression in CRSwNP (n = 24) was presented. The Spearman rank correlation coefficient was used for statistical comparison.

