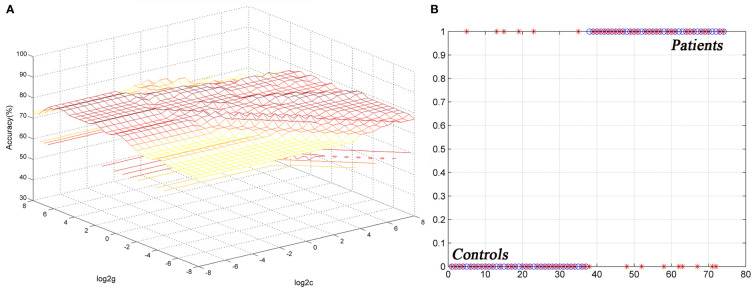
Figure 4.
Differentiating the patients from the controls by using the increased ReHo values in the right STG. Visualization of classifications via a support vector machine (SVM) by using the ReHo values in the significantly different regions. (A) result of SVM parameter selection via a 3D view; (B) classified map of the ReHo values in the right STG. ReHo, regional homogeneity; STG, superior temporal gyrus.

