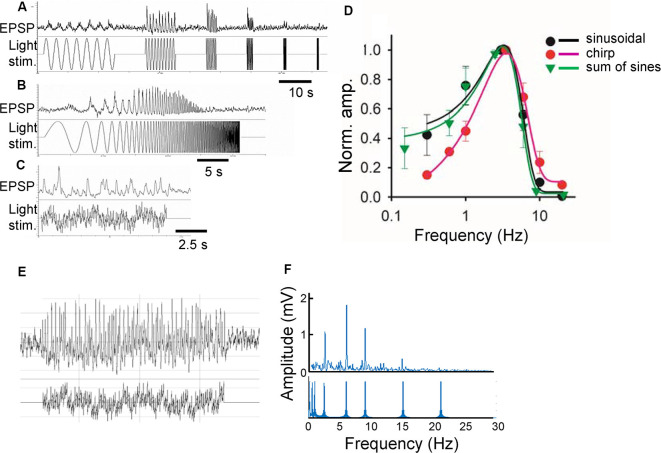
Figure 1.
Comparison of three stimulus functions. (A) Sinusoidal light stimuli from 0.3 to 20 Hz (lower) and a representative response (light-evoked postsynaptic potentials; L-EPSP; upper). (B) Chirp light stimuli and L-EPSP with the same frequencies from the same cell. (C) Sum of sinusoidal light stimuli of similar frequencies and L-EPSP. (D) Comparison of L-EPSPs evoked by three functions (n = 3 ganglion layer cells). (E) A representative L-EPSP from bipolar cells (upper) evoked by a sum of sinusoidal light stimulation (lower). (F) An fast fourier transformation (FFT) analysis of the traces (E) revealed the different frequencies of light stimuli (lower) and the amplitude of L-EPSP for each frequency.

