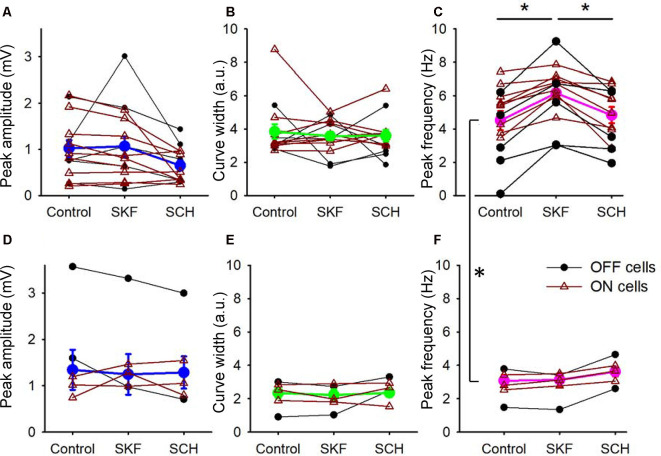
Figure 4.
D1R signaling modulated the peak frequency, but not for the peak amplitude and the tuning curve width. (A) The peak amplitude of the frequency-response curves for the SKF-sensitive bipolar cells. Each dot-line represents one cell, and the average is shown in thick blue. ON and OFF cells are color-coded in brown and black, respectively. Both SKF and SCH did not change the peak amplitude. (B) The tuning curve width of the frequency response curves for the SKF-sensitive bipolar cells. Individual cells (brown and black) and the average (green). Neither SKF nor SCH changed the average tuning curve widths. (C) The peak frequency of the frequency-response curves for the SKF-sensitive bipolar cells. Individual cells are shown in brown and black, and the average is shown in magenta. SKF significantly increased the peak frequency (p < 0.01), which was reversed by SCH application (p < 0.01). (D–F) The same set of parameters for SKF-insensitive bipolar cells. The D1R agonist and antagonist changed none of the three parameters. (C,F) The peak frequencies in control solutions for the SKF-sensitive and -non-responsive bipolar cells are significantly different (p < 0.01, *p < 0.05).

