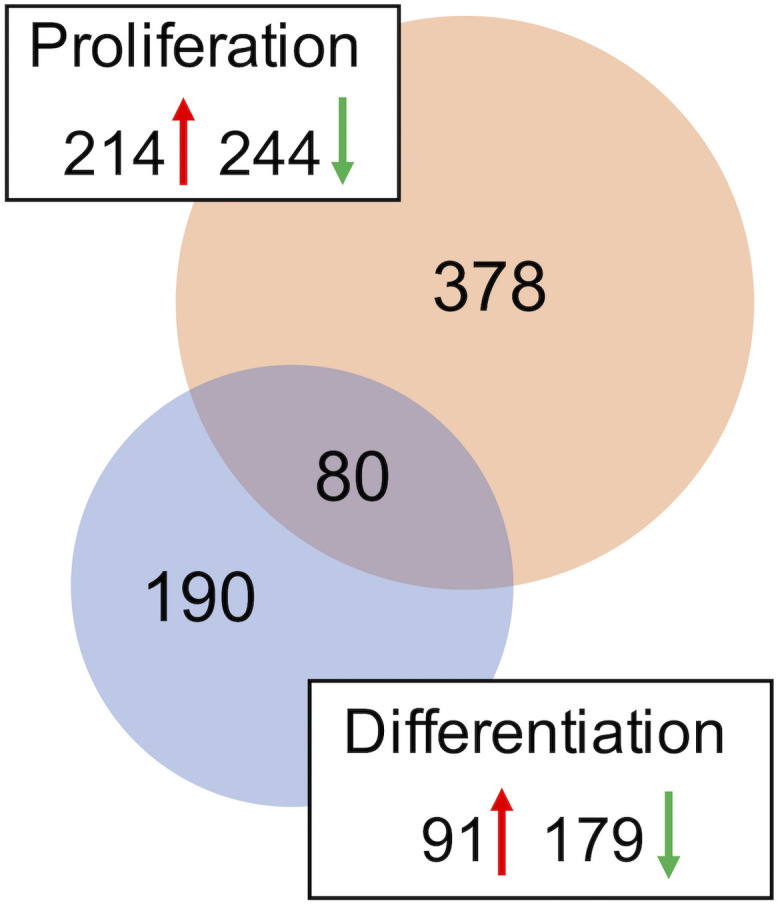
FIGURE 2.

Distribution of differentially expressed genes in the turkey satellite cells. For each comparison, the number of significant genes (FDR p-value < 0.05) shared or unique to each treatment are indicated in the Venn diagram. Circle size is proportional to the number of genes and direction of expression change (↑ or ↓) is given for each group.
