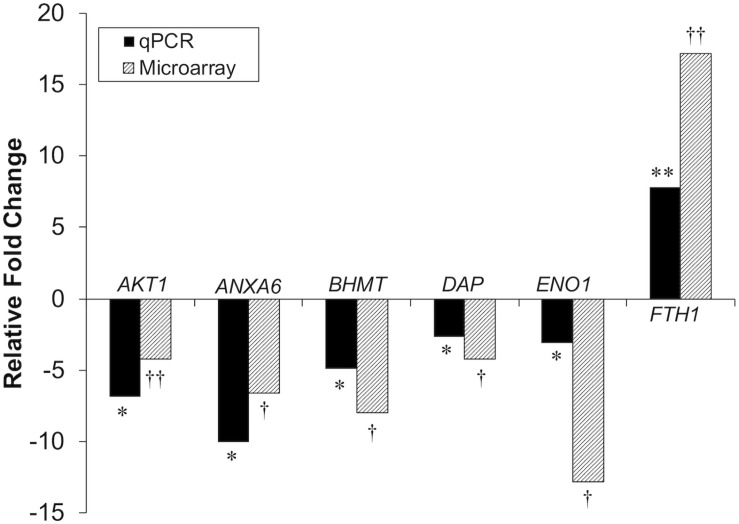
FIGURE 3.
Microarray and qPCR data show similar trends of gene expression in proliferation experiments. Fold change is defined as the change in gene expression in the DAP knockdown samples relative to control samples. Bars below the origin indicate lower expression (down-regulation) of the gene in the DAP knockdown samples; bars above the origin indicate higher expression (up-regulation). *P < 0.05, **P < 0.01, †FDR < 0.05, and ††FDR < 0.01. AKT1, Akt1; ANXA6, Annexin A6; BHMT, Betaine-homosysteine S-methyltransferase; DAP, death-associated protein; ENO1, enolase 1; FTH1, Ferritin heavy polypeptide 1.

