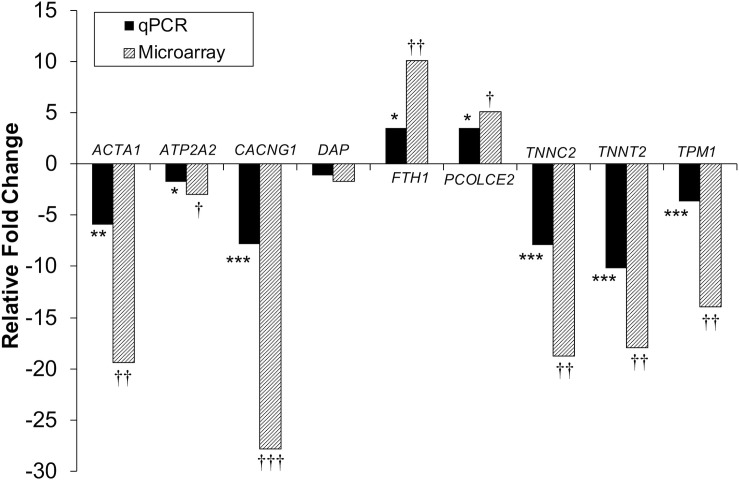
FIGURE 4.
Microarray and qPCR data show similar trends of expression differences in differentiation experiments. Fold change is described as change in gene expression in the DAP knockdown samples relative to controls. Bars below the origin indicate lower expression (down-regulation) of the gene in the DAP knockdown samples; bars above the origin indicate higher expression (up-regulation). *P < 0.05, **P < 0.01, ***P < 0.001, †FDR < 0.05, ††FDR < 0.01, and †††FDR < 0.001. ACTA1, actin alpha 1 skeletal; ATP2A2, sarcoplasmic/endoplasmic reticulum ATPase 2 cardiac; CACNG1, voltage dependent calcium channel gamma 1; DAP, death-associated protein; FTH1, ferritin heavy polypeptide 1; PCOLCE2, procollagen C-endopeptidase enhancer; TNNC2, Troponin C type 2 fast skeletal; TNNT2, Troponin T type 2 cardiac; TPM1, Tropomyosin 1.

