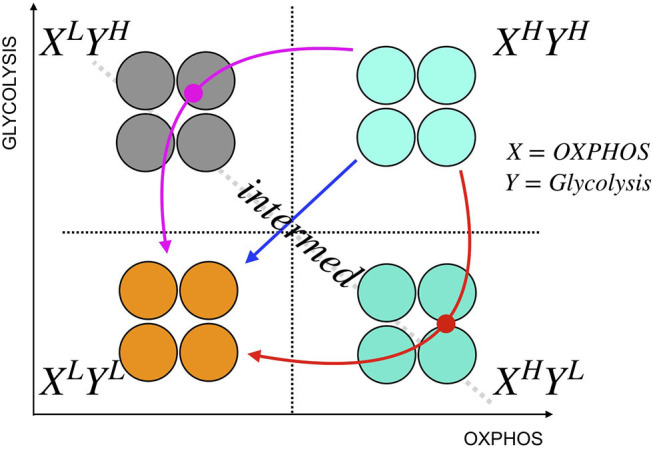
Figure 4.

A schematic illustration of cancer metabolic plasticity and resulting phenotypes. Tumor populations can exhibit distinct metabolic phenotypes that co-exist, and the proportions of cells in each state give rise to unique cell phenotype, and metabolic profiles. Depending on the cell types, and the drugs used, tumor cells could follow different paths to switch among the phenotypic states. In addition, tumor cells can transition into the same end state (L/L) via different paths; the red path shows the transition of tumor cells from XHighYHigh state to XLowYLow state via XhighYlow state, the magenta path shows the transition from XHighYHigh state to XLowYLow state via XLowYhigh state, and the blue path shows a direct transition from XHighYHigh state to XLowYLow state. In this schematic, X represents capacity of cells to use OXPHOS, and Y represents the capacity of cells to use glycolysis.
