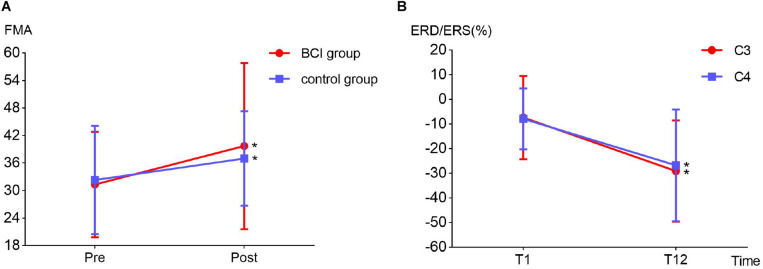
FIGURE 6.
(A) Fugl–Meyer assessment improvement between BCI group (12.77%, p = 0.032) and the control group (7.14%, p = 0.048) before (T1) and after (T12) the intervention. (B) Event-related desynchronization change in the ipsilesional (channel C3, p = 0.032) and contralesional (channel C4, p = 0.029) hemispheres before (T1) and after (T12) the intervention in the BCI group.

