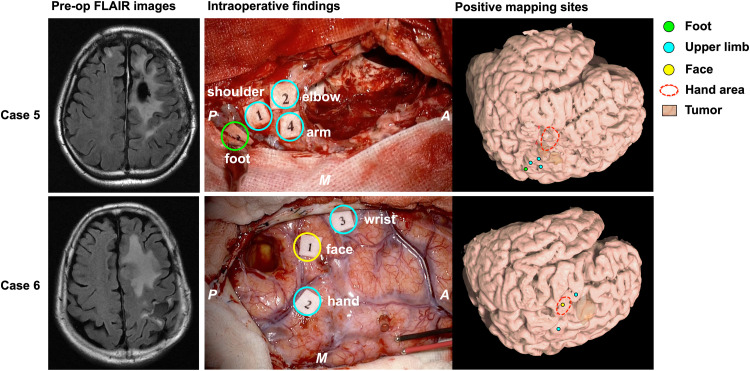
FIGURE 4.
Patients whose motor function moved according to Type 2. The left columns show the preoperative FLAIR images; the middle columns show the intraoperative findings; the right columns show the positive mapping sites for each patient’s brain reconstructed from structural MRI. In Case 5 (upper column), the motor area of the upper limb was observed next to the foot area. In case 6 (lower column), the face area was found between the hand and the wrist area. Green circle: positive mapping site of foot; cyan circles: positive mapping sites of upper limb including shoulder, arm, elbow, hand, and wrist; yellow circle: positive mapping site of face; red broken line: knob area in the precentral gyrus, namely, the hand area. A: anterior; P: posterior; M: medial side.

