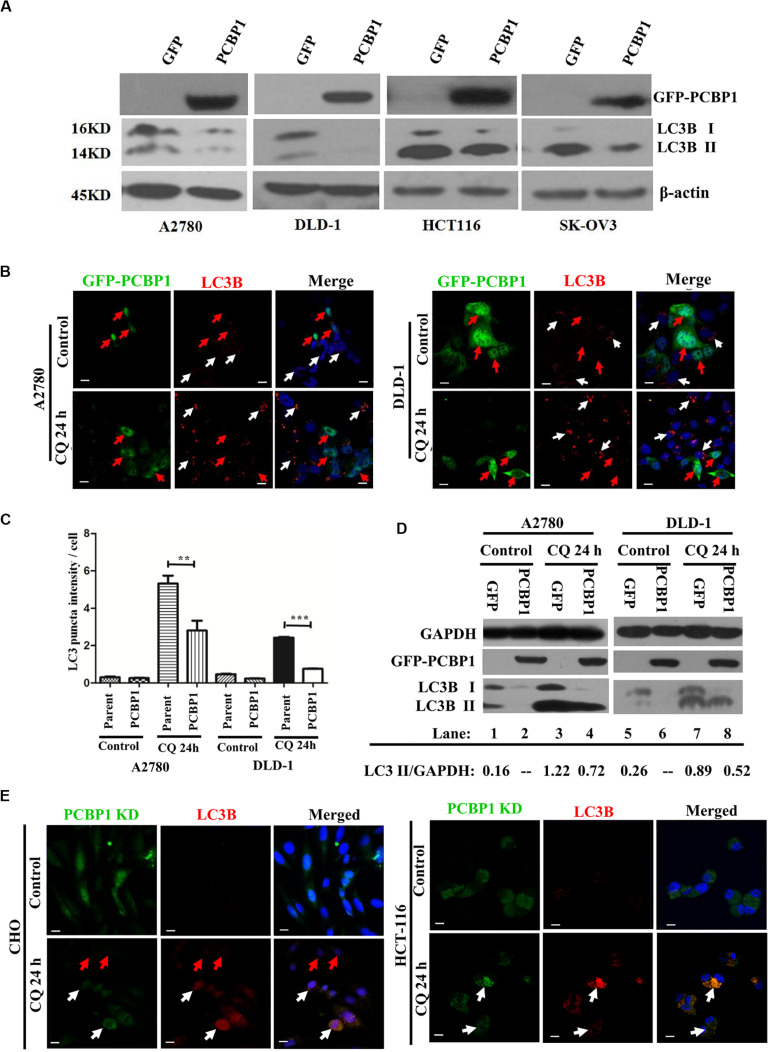
FIGURE 2.
PCBP1 Overexpression represses autophagy. (A) Immunoblots of PCBP1, LC3B I and II in PCBP1-overexpression (GFP-PCBP1) and the GFP control cells. β-actin is used as an internal loading control. (B) Immunofluorescence staining of LC3B puncta in both A2780 and DLD-1 cells with or without CQ treatment for 24 h. GFP-PCBP1 cells are in green, while parent control cell are not green. Cells counterstained with DAPI are shown in blue. White arrows point LC3B puncta (Red) in the parental control cells without GFP-PCBP1 transfection (not green), while the red arrows point LC3B puncta in GFP-PCBP1-transfected cells (green). Bars equal to 25 μm. (C) Quantifications of LC3B puncta intensity per cell in B are presented as histograms (mean ± SD). Parent group indicates the parent control cells without GFP-PCBP1 (not green), while the PCBP1 group indicates the cells with transfected GFP-PCBP1 (green). **P < 0.01; ***P < 0.001, n = 5. (D) Immunoblots of LC3B I, II in A2780 and DLD-1 cells with PCBP1 and GFP overexpression. Upon CQ or DMSO (control) treatment for 24 h, cells were analyzed. Immunoblot intensity ratio of LC3B II to GAPDH were, respectively, quantified and normalized, and indicated in each lane. (E) Immunofluorescence staining of LC3B puncta in both A2780 and DLD-1 cells with or without CQ treatment for 24 h. PCBP1 knockdown (KD) cells are in green, while parent control cells are not green. Cells counterstained with DAPI are in blue. White arrows point LC3B puncta (Red) in the PCBP1 KD cells, while the red arrows point LC3B puncta in the parental control cells. Scale bars in (B,E) equal to 25 μm.

