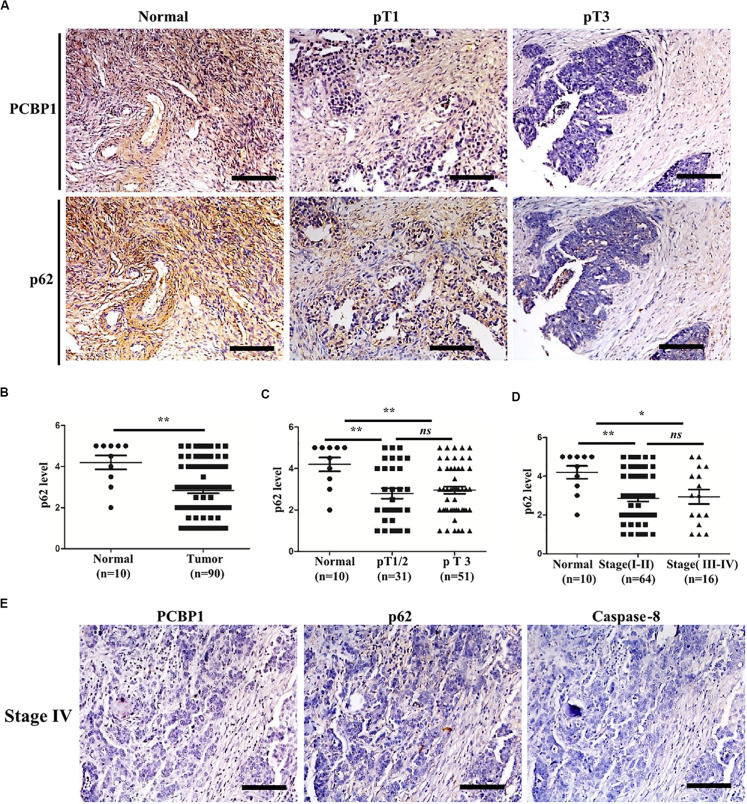
FIGURE 7.
Relevance of PCBP1 to p62 and caspase 8 in ovary cancers. (A) Representative immunohistochemistry (IHC) analysis of p62 expression in the paired adjacent normal tissues and their ovarian tumor samples. pT1, tumor without pelvic spread; pT3, tumor with micro-metastasis of extra pelvic peritoneum confirmed by microscope. (B) Statistical comparison of p62 expression between normal and tumor tissues detected in (A). (C) Statistical comparison of p62 expression between the pT1/2 group (tumors with or without pelvic spread) and the pT3 group (tumors with micro-metastasis of extra pelvic peritoneum confirmed by microscope). (D) Statistical analysis of p62 expression with tumor progression (clinical stage). (E) Representative PCBP1, p62 and caspase 8 expressions in a same ovary tumor sample with clinical stage IV. All images in are photographed with 200X amplification. Scale bars on equal to 100 μm. *P < 0.05; **P < 0.01; ns, no significance.

