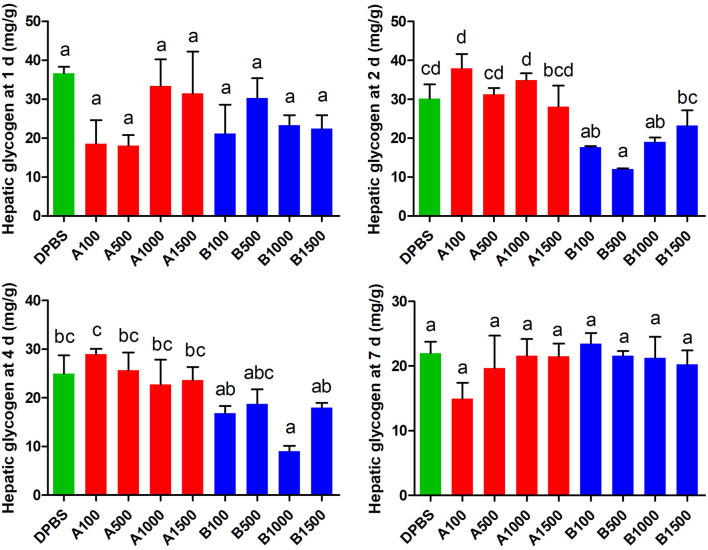
Figure 3.
The effects of intraperitoneal injection of LepA and LepB on hepatic glycogen levels at 1, 2, 4, and 7 d. Data represent means ± S.E.M (n = 6). The colors of bars were shaded according to intraperitoneal injection of different solvent (green: DPBS, red: LepA, blue: Lep B). Significance level are marked with different letters (P < 0.05), compared with the values from DPBS injected mandarin fish.

