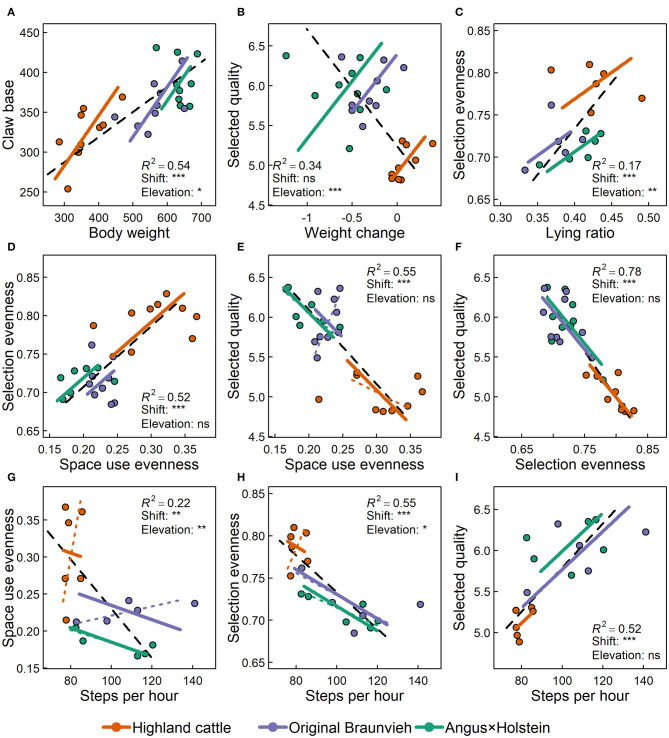
Figure 7.
Selected allometric relationships among variables concerning anatomy, movement and foraging behavior of three cattle breeds. Panels (A–I) show allometric relationships of body weight (kg), claw base (cm), average daily body weight change over 10 weeks on alpine pastures (kg/d), the average number of steps recorded per hour, the ratio of the time spent lying, the evenness of space use, the evenness of plant species selection, and the average forage quality of the selected plants (21). The number of recorded steps and lying ratio were available for six cows per breed and the other variables for nine cows per breed. Figures show the overall allometric line for all animals (dashed black) with their regression coefficient (R2) as well as allometric lines for each of the three breeds. For all allometries where the slope differed significantly among breeds, the breed-specific allometric lines are provided (dashed lines) together with the forced common slope (solid lines). This was necessary for testing shift and elevation, for which significances of differences among breeds are given (nsp > 0.1; *p < 0.05; **p < 0.01; ***p < 0.001).

