Figure 3.
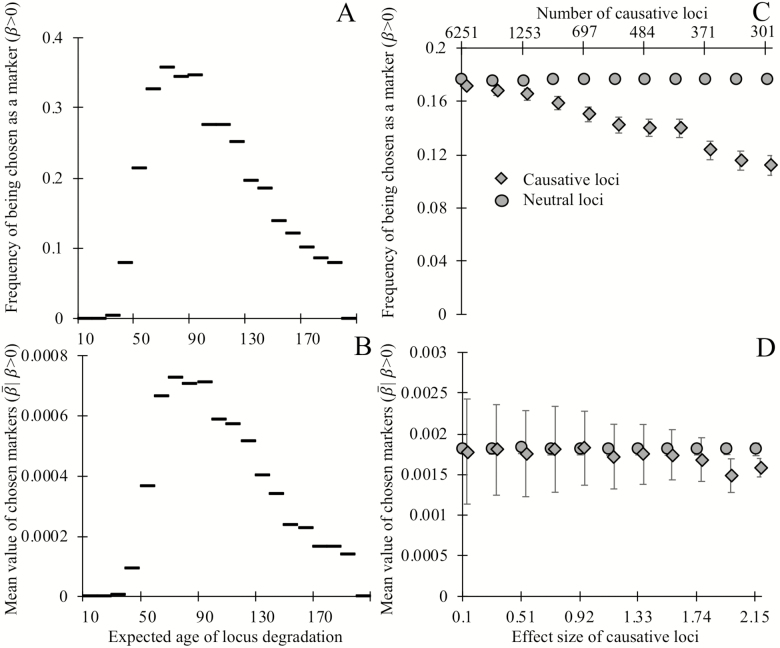
Biomarkers selected on their ability to predict chronological age tend not to be causative for aging, and degrade, on average, late in life. Loci whose expected time of degradation is late in life (age 50+) are chosen as biomarkers of aging (A) more often and have larger regression coefficients (in units of degradation status/year) when chosen as biomarkers (B), than loci that degrade earlier in life (note that all loci in panels A and B are noncausative). Causative loci (diamonds) are less likely to be selected as biomarkers (C) than neutral loci in the same genome (circles). Of the loci selected as biomarkers (D), the magnitude of regression coefficients of causative loci is slightly smaller, on average, than those of neutral loci, at least when causative loci are of fairly large effect (>2%). Panels A and B show the outcome of a single simulation in which each of the 20,000 loci have expected ages of degradation 1 + 199 (i/20,000) for integers i = 0 through 20,000. All loci are neutral and mortality is determined by equation (1). Horizontal lines indicate the y-axis value corresponding to the 200 loci in each bin. A degradation time well above human lifespans indicates a locus with a low probability of degrading prior to death. Each point in panels C and D shows the mean outcomes of six independent replicate simulations in which each of the 20,000 loci are either neutral or have a single causal effect size (non-round-number effect sizes are an artifact of making choices using an alternative effect size metric). Mortality is determined by equation (2), with the numbers of causative loci (top x-axis C,D) inversely proportional to the effect size of a causal locus (bottom x-axis C,D). In panels C and D, all loci have an expected age of degradation of 75 years. Error bars show standard errors; markers for causative loci have been offset slightly to the right.

