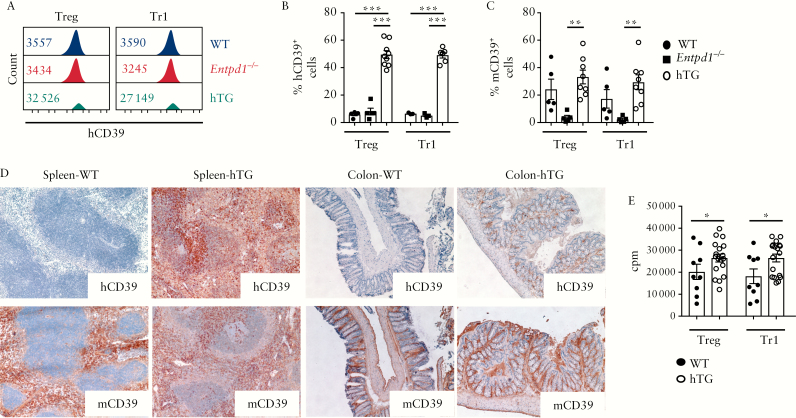
Figure 1.
Treg and Tr1 cells from hTG mice display higher frequencies of mCD39+ cells and show increased proliferative capacity. [A] Histogram plots of human CD39 [hCD39] MFI of Treg and Tr1 cells obtained from a representative WT, Entpd1−/− and hTG mouse. Numerical values of hCD39 MFI are indicated within the histogram plots. [B] Mean ± SEM frequency of hCD39+ cells within Treg and Tr1 cells of WT [n = 3–5], Entpd1−/− [n = 3–5] and hTG mice [n = 6–9]. [C] Mean ± SEM frequency of mCD39+ cells within Treg and Tr1 cells of WT [n = 5], Entpd1−/− [n = 5] and hTG mice [n = 8]. [D] Representative hCD39 and mCD39 staining of frozen sections from the spleen and colon of WT and hTG mice. Staining from one of three independent experiments is shown [original magnification, ×20]. [E] Proliferation of Treg and Tr1 cells obtained from WT [n = 9] and hTG [n = 18] mice was measured by 3H-thymidine incorporation. Mean ± SEM counts (cpm) are shown. *p ≤ 0.05;**p ≤ 0.01;***p ≤ 0.001.

