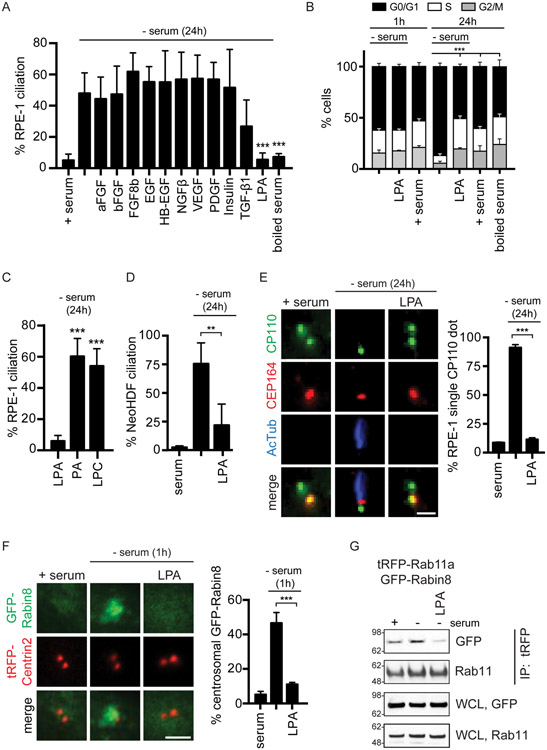
Figure 1: LPA inhibits serum starvation-induced ciliogenesis and Rab11-dependent Rabin8 preciliary trafficking.
(A) Quantification of ciliation in RPE-1 cells grown in 2% serum, 2% boiled serum, or treated with indicated growth factors (25ng/ml) for 24h in the absence of serum followed by staining with acetylated a-tubulin (Actub) and pericentrin antibodies. 5μM of LPA was used with 0.1% BSA vehicle . Mean ± s.e.m from three independent experiments is shown for serum, starvation, TGF-β1, boiled serum, and LPA; Mean ± s.d. are shown for rest of the growth factors two independent experiments. n>65 cells were counted for EGF, HB-EGF, and insulin. All other treatments n >150 cells counted. ***P < 0.001.
(B) Cell cycle analysis was performed on cells treated for 1h and 24h as described in (A). Representative plot (mean ± s.d.) of G0/G1, S, and G2/M cells determined by analyzing nuclear DAPI staining from images captured using a Celigo Image Cytometer from two (1h) and n=3 (24h) independent experiments. P <0.001 (***) for G0/G1 are shown.
(C, D) Ciliation quantification in RPE-1 (C) and NeoHDF (D) cells stained as described in (A). 5μM of LPA or its precursors were used. Mean ± s.e.m from three independent experiments. n>150 cells counted ***P < 0.001, **P < 0.01.
(E) (Left) Representative images of RPE-1 cells grown in serum or treated with or without LPA for 24h as in (A) in the absence of serum and stained with CP110 and CEP164 antibodies. (Right) Corresponding quantification of RPE-1 cells with single CP110 dot. Mean ± s.e.m from three independent experiments is shown. ***P < 0.001. Scale bar = 2μm.
(F) (Left) Representative images of RPE-1 GFP-Rabin8 + tRFP-Centrin2 cells grown in serum or treated with or without LPA as in (A) for 1h in the absence of serum and imaged by live epifluorescence microscopy. (Right) Corresponding quantification of GFP-Rabin8 centrosomal accumulation. Mean ± s.e.m from three independent experiments is shown. ***P < 0.001. Scale bar = 2μm.
(G) Immunoprecipitation of tRFP-Rab11a from RPE-1 cells stably-expressing GFP-Rabin8 and tRFP-Rab11a following incubation in serum, 1h starvation, or 1h starved and LPA-treated (5μM). tRFP antibody was used for IP. Blots were probed with GFP and Rab11 antibodies. Representative image from three independent experiments is shown.
See also Figure S1.

