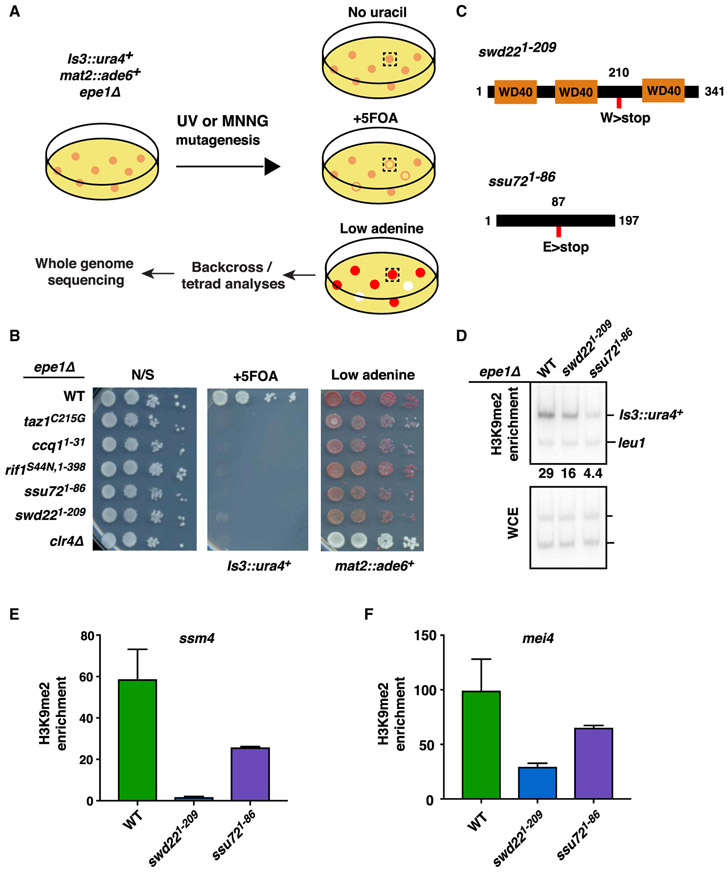
Figure 1. Genetic Screen for Factors Required in RNAi-Independent Heterochromatic Silencing.
(A) Genetic screen to identify mutants specifically defective in silencing Is3::ura4+.
(B) Serial dilution spotting assay for expression of Is3::ura4+ and mat2::ade6+. Expression of Is3::ura4+ leads to growth defects on medium containing 5FOA. Expression of mat2::ade6+ results in white colonies on low-adenine medium. Also shown is growth on non-selective medium (N/S).
(C) Graphical representation of Swd22 and Ssu72 protein domains. Nonsense mutations identified in the genetic screen are indicated by red rectangles.
(D) ChIP-qPCR analysis of H3K9me2 enrichment at Is3::ura4+ in CPF mutants. Numbers are enrichment values of Is3::ura4+ relative to the control leu1 locus.
(E and F) H3K9me2 enrichment at (E) ssm4 and (F) mei4 loci as assessed by ChIP-qPCR analysis. Enrichment values are fold changes relative to the leu1 control. n = 2. Error bars are shown as SDs from the mean. Oligonucleotides are listed in Table S5.

