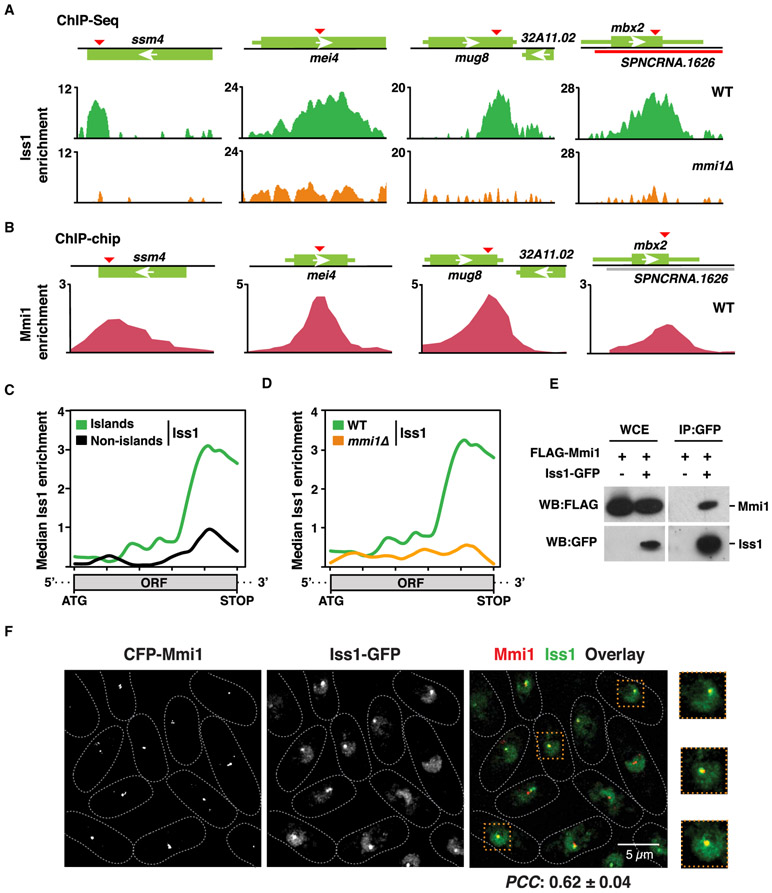
Figure 4. Mmi1 Recruits CPF to Facultative Heterochromatin Islands.
(A) ChIP-seq analysis of the core CPF subunit Iss1-GFP in the WT (top) or mmi1Δ (bottom). Enrichments at meiotic island loci are shown. DSR motifs are indicated by red triangles.
(B) Chromatin immunoprecipitation combined with microarray (ChIP-chip) enrichment of CFP-Mmi1 in the WT at the indicated meiotic island loci.
(C) Median Iss1-GFP ChIP-seq enrichment over H3K9me island Mmi1 regulon genes (n = 7) versus non-island (n = 21) Mmi1 regulon genes in WT cells as determined by ChIP-seq.
(D) Median Iss1-GFP ChIP-seq enrichment over island Mmi1 regulon genes (n = 7) in WT (green) or mmi1Δ (orange) cells.
(E) Core CPF subunit Iss1FIP1 coimmunoprecipitates with the YTH family protein Mmi1. The purified Iss1-GFP fraction was probed for FLAG-Mmi1.
(F) Colocalization of Mmi1 and CPF in live WT cells expressing CFP-Mmi1 and Iss1-GFP. Also shown are zoomed insets (dashed orange boxes) of 3 representative cells. The scale bar represents 5 μm. PCC was calculated to quantify population-wide colocalization of Mmi1 and Iss1FIP1.
For all median enrichment analyses, the base coordinate ranges of genes were scaled to a common length from the start codon to the stop codon of the open reading frame (ORF). Island and non-island Mmi1-regulon genes are listed in Table S3.

